A Market Timing Report based on the April 29, 2022 close…
The Fed usually explains that it has two mandates, “Full employment and price stability.” What they don’t tell you is that they favor price stability over employment when push comes to shove. By employing the last person needing a job, you drive up inflation, which defeats the purpose as it degrades the well being of even more people who are bordering on poverty.
They have ONE mandate now: Get Inflation Lower. They must, because the political damage from inflation in the midterm elections is likely to be great, and it will take time to bring inflation down.
I now expect the GOP to take back both the House, which was assumed, as well as the Senate, because of the level of inflation, and from the economic slowing that is likely as a post-Fed party and Congressional Stimulus hangover. BOTH parties are responsible for sending checks to many who did not really need them.
I am not saying the checks were not deserved by some, particularly poor savers who have gotten nearly ZERO on their cash for many of the years since 2009. I’m focused here on the fact that the extra funds, first from Trump/GOP and then from Biden/Dems, fueled inflation, as did the shift from services spending to spending on goods during COVID, the fault of no one.
Trump’s tax cuts, which were unpaid for from the start, continue to add to inflation as well. We did not have the money to decrease the top marginal rates on very wealthy people, like it or not politically. That was the 3rd failure by the third U.S. president of what I call “Tinkledown Economics.”
The “Tinkledown” GOP Tax Cut policy failed to create tax revenue to pay for the tax cuts THREE times, under Reagan (he left us with a 3 Trillion dollar national debt), G.W. Bush, and Trump. I wish the upper middle class on down would stop buying into that GOP lie. (I’m a fiscal conservative and a registered Independent as my loyal readers know.). Bad fiscal decision making is a bipartisan illness.
The big COVID Retirement also hurt goods production and drove up inflation. Spot shortages have even hit Florida, although they are inconveniences, not deprivations that others must endure.
Many like staying home vs. going to work apparently! The stock market decline may end up driving some of those retirees and Bull market traders back to work, but the big retirement wave has made it tough for many businesses to find workers, which has driven unemployment back down to 3.6% last month (it reached 3.5% under Trump) and wages up about 6%.
While there’s inflation, there has also been wage inflation, just not enough to make up for inflation. As of Jan. 2022, “Real wages fell by 2.4 percent over the last year and are now 1.2 percent lower than they were in December 2019. If real pay had kept pace with its pre-pandemic trend, it should have risen by 2.1 percent over the period.” Ref. Wage Chart. Where wages should be and where they are. (see chart at that link)
Inflation has continued higher since, although Bloomberg data says that the inflation rate will be falling through the end of 2022 from its peak. As of March, the Consumer Price Index (CPI) “rose 8.5 percent over the last 12 months, not seasonally adjusted.” Ref. BLS – US Inflation Update
If there was one thing that killed President Jimmy Carter’s chance of a second term, it was the off-the-wall inflation rate back then of 14.4% at the peak in the late 1970s, just before the 1980 Election.
The probable election losses (the Senate loss is not written in stone quite yet although the loss of the House is highly probable per recent stats and historic results for a midterm elections) mean there will be no major programs passed by Congress through 2024. Sen.s Joe Manchin and Krysten Sinema can take a rest most likely from being the center of attention.
Although POTUS Biden’s approval rating is climbing again, back to 42% from 37% in part due to approval of his Ukraine War leadership, a Biden re-election may be imperiled by
1. Continuing inflation along with loss of stock market gains since he took office, which we know is largely due to factors beyond his control, just as the initial market decline under Trump during COVID was not Trump’s fault (his objectively weak leadership around the COVID pandemic was unhelpful, however).
2. Biden’s age, especially if things deteriorate for him. Biden is now 79 yrs old. Once a person gets that old, there is a chance of simply dropping dead unexpectedly. The average risk of death for 75-84 year olds is 5.0% per the CDC. (That would also apply to Trump by 2024 as he’s 75 yrs old now. The GOP would do better with a younger candidate who could also serve two terms.)
All this means the Fed has to get inflation off the table as a political risk before 2024, or they run the risk of looking partisan. There will be no other excuses for inflation EXCEPT the Fed by then.
Recently I posted a link to a chart showing that oil production had INCREASED under Biden. It probably will increase even more simply due to the high pricing. You make hay while the sun shines. The Europeans’ oil problem is worse, given their dependence on Russian oil and natural gas, but the global nature of energy markets could prevent US prices from dropping by very much without a substantial increase in production.
The key is this – the Fed has said out loud that it will need to SLOW the economy to get inflation down. Since inflation is its SOLE MANDATE for now, that will increase unemployment and bring down wages over time. Less GDP growth means lower revenues for companies, which means lower stock prices. It will take the Fed multiple hikes to get inflation down. They still want to move stepwise in 50 basis point hikes (0.50%), but they will be steady until the markets react so negatively that they are moved to pause.
The Treasury trade game is (when the Fed really gets going with their hiking!):
1. Short rates up (by the Fed)…
2. Economic slowing foreseen (inflation expectations falling) or GDP growth slowing actually happening…
3. Long rates down. Long bonds and Treasuries up. The latter is NOT yet happening. Interest rates have yet to change to a downtrend. When they do, there will be an investment opportunity for a trade.
Where Among Stocks Can You Hide from the Tech Re-Valuation Crash?
IF the major indexes all break lower with IWM, even the places investors have been “hiding,” like XLP, Consumer Staples Sector of SPX, won’t work. Here is why…
XLP went up because 1. The staples companies can pass on much of the inflation, because they sell “staples,” or necessary, non-optional products and 2. The long only traders have to shift from stocks that aren’t working into something else that is cheaper on a PE basis as rates rise and kill off the high PE Tech stocks.
Either way they are vulnerable because 1. If the market bounces, that means tech will be bouncing and the rotation back into tech and consumer discretionary works against XLP. 2. IF the indexes crash to new lows (IWM already testing below the prior lows), valuation is relative and XLP will sell off too, just not quite as much percentagewise, but all sectors will be losers.
The same goes for other sectors that are supposed to work on a relative basis during a period of economic slowing and declining inflation such as healthcare, utilities and REITs (if we see that; current projections are that inflation will drop into year end; remember inflation rates are RELATIVE to the prior year’s pricing).
Follow Me on Twitter® Follow Me on StockTwits®. (real time messages are on StockTwits as always and back on Twitter)
Keep up-to-date and read my comments on the current setup during the week at Twitter and StockTwits (links below) where a combined 35,452 investors are following the markets with me…
1. SP500 Index Market Timing (S&P 500 Index®; SPY, SPX):
How has my method of “Passive Shorting™” worked?
All exposure levels are “percentage of usual maximum Bull market exposure.” If you are normally at 80% stocks and I move to 50% of usual max., you would go to 40% exposure to equities if you agree with my decision. Numbers over 100% indicate use of cash, NOT leverage, which works during a Bull market and then punishes during a Bear market.
TOP 11-08-2021 106.75% (I round to the nearest 0.25%)
1-11-22 107.50%
1-14-22 98.50% (broken trend)
1-19-22 85.25% (took off more exposure on further break lower)
1-26-22 90.25% (indicators pointed to a bottom) Added 1-24 and 1-26.
2-02-22 80.50% (sold exposure close to the lower high on 2-01-22 and 2-02-22)
2-25-22 80.40% (added back exposure to the level of 2-02 near the low in Feb. on 2-02-22 and on 2-24-22, the actual low).
4-01-22 72.00% (sold a chunk of exposure near the last lower high on 03-30-22, the day after the actual high day of 03-29-22, and on 03-31-22, and 4-01-22, days 2 and 3 off the high).
I have not bought back exposure at this retest of the lows yet. I have sold some individual stock exposure as individual stocks have broken down to new lower levels to protect profits.
Why not? Because there is a risk that we break down further. Sometimes multiple tests of lows fail after several attempts to hold them. Some may believe the Fed is going to be a bit dovish at the edges to take some pressure off of stocks, but I have already stated on social media that such a move is impossible.
Although as I said on social media late this week (links above), my indicators favor a bounce from here, some of the strength I saw on Thursday, was weakened on Friday, and NO ONE can tell you if the current levels will hold.
I’ll say more about that in the next part on Small Caps (IWM)…
If you don’t know my market naming “Rules,” they are HERE (scroll to “New Rules” in blue type).
Click the chart to see the details…

Will it hold?
Now let’s review investor sentiment…
Survey Says!
Sentiment of individual investors (AAII.com) showed a Bull minus Bear percentage spread of -42.9%, which has not been seen for 32 YEARS! I need to be brief to get this issue out but here are the key numbers and dates:
US Recession 7-1990 through March 1991.
Gulf War: 8-02-90 to 2-28-91
8-16-90 -41.0% Bull Bear Spread
8-30-90 -38 .0%
9-20-90 -43.0%
9-27-90 SPX 295.98.
10-11-90 Low in the SP500 Index at 294.46.
Mid-October 1990 Oil up 119% due to the war.
10-18-90 -54%
Desert Storm (U.S. war to free Kuwait) 1-17-91 to 2-28-91
Note that the Gulf War was also an oil related event. Oil went from $21/barrel to $28 by Aug. 6, 1990 and then to $46/barrel by mid-October 1990.
Note there is room for sentiment to get even worse, although that would come from a recruitment of more Bears rather than loss of many Bulls. On 10-18-90, Bulls were 13.0% and Bears were 67.0% vs. 16.4% and 59.4% today. Even the current numbers are extreme as noted, which is ONE factor that suggests the market could hold either at these levels or somewhat below them. Could…
Note that in 1990, the S&P500 Index reached a point barely above the ultimate low in October, just one week after the -43.0% reading on 9-20-90. In other words, at least back then, a further deterioration of sentiment did not add to the drawdown significantly.
This is not to say we can conclude what will happen today will match what happened in 1990, as the context is VERY different. It could get worse, due to the Fed. In 1990, the Fed was in the process of lowering interest rates, NOT raising them.
The prospect of significantly higher rates added to the oil stress could certainly lead to at least a mild recession and a 1990’s level (also a mild recession) pullback in stocks. That would be -20% for the SPX which would mean -30% or more for Tech and small caps IMO. (The COVID Crash lows were SPX -35%. IJH and IWM -45%. QQQ bottomed at -30.55%, but given rising interest rates, Tech would probably match IWM on a further drawdown in the “Big Red Wave.”)
| Bulls | Neutrals | Bears |
| 16.4% | 24.2% | 59.4% |
| Thurs. 12 am CT close to poll | ||
Now let’s look at the small caps, gold, and interest rates…
2. U.S. Small Caps Market Timing – Russell 2000 U.S. Small Cap Index (click chart to enlarge; IWM, RUT)
Small caps have failed to hold the prior 2022 lows. Though sometimes small caps overshoot vs. the large caps at bottoms, they need to reverse quickly from the breach (within 1-2 days optimally).
Look at what happened to small caps when they violated the long consolidation range low that held throughout 2021. It got us to these levels.

Small caps have broken the prior lows of 2022.
Gold is next…
3. Gold Market Timing (click chart to enlarge; GLD):
I started my comment for the last post on gold with “Gold was caught up in the Friday ‘Sell Everything’ pattern.” Deja vu. Friday was a “Sell to Cash” day.
Gold moved up out of the triangle I pointed out in the prior issue, which was a great trade.
This time gold is coming off a top and has breached a similar triangle to the downside. They work both ways!
To recover, GLD must rise back above the 6-01-22 high of 178.85. If it does not, that orange line may prove to be a level of interest. We only know if and when we get there! They are “Levels, not Targets” as I like to say.
The March lows COULD yet save GLD from that sort of fall, but I believe it will sell off with everything else if the stock indexes break down further…
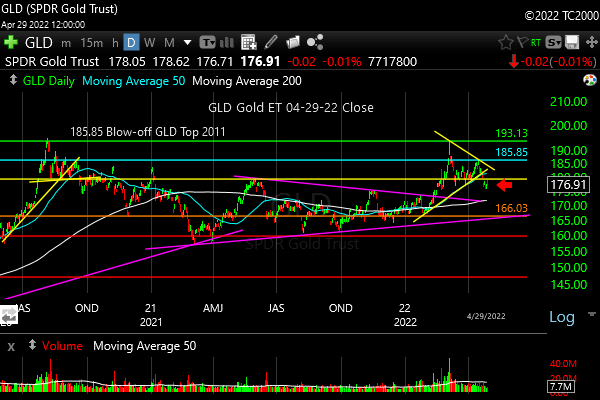
Gold could be sold off in a move to higher liquidity. That may have started.
Check out the “Market Signal Summary” below – after you review the following chart…
4. Interest Rate Market Timing (10 Year Treasury Yield; click chart to enlarge; TNX, IEF, TLT):
My prior suggestion of lower levels of interest rates holding were not borne out. Not even close. That’s why I simply examine the behavior of the market vs. predicting the future. I do consider potential levels using different methods, but in the end none of them count as predictions. They are possibilities.
In my early buys of TLT recently, I violated that principle to attempt an early entry. Bad idea. My failure, for now, with that trade, which was fortunately not a large one, because I kept the position size small as an early trade, was that there were many sources/voices that were suggesting the Fed could not raise rates much without taking down the economy.
I take 100% responsibility for buying into bad inputs though, as we all should. To be fair, the Fed did surprise the market by doing a pile on with both rate hikes and balance sheet reduction going on simultaneously. Perhaps they could have just let their balance sheet run off had they raised rates early enough. “They are lagging” is the common refrain about the Fed now…
I’ve gone over the interest rate game in the top section, but the key is to wait for the trend to change…
And now to the WEEKLY chart…
Note that on high magnification you would see the current 10 Year Yield is ABOVE the top yellow line, which means it’s back to being STRETCHED to the upside and vulnerable to correction. The trend is still UP for now however….

Rate trend has not yet reversed.
Now let’s review three key market timing signals together….
Do not use these signals as a trading plan. They are rough guidelines. I currently share my actual BUYS and SELLS in as timely a way as possible on social media (links above).
MY MARKET SIGNAL AND TREND SUMMARY for a Further U.S. Stock Market Rally with Real GDP Growth (“Real” means above inflation):
Stock Signal Bearish for a further U.S. stock market rally with a short term Bearish and longer term Bearish SP500 Index trend. The small caps determine the stock signal in this section of the report.
My longer term view of SPX could change if it holds the Oct. low and bounces.
Gold Signal NEUTRAL for a further U.S. stock market rally. The Gold Trend is short term NEUTRAL and longer term Bullish (on an intermediate term, it won’t be below the March lows). As said before, “If real rates rise as the Fed acts, gold will be hurt, but in the short term, the Fed is hiking into economic slowing Y/Y, so that means rising short rates can LOWER long rates, which could help gold by depressing long term real rates.”
Kept for Reference: “Gold can RISE with stocks when real rates are FALLING, and the dollar is falling. The dollar has been stronger of late, due to the Fed’s planned pivot. Gold could rise WITH the dollar if the economy slows and real long rates fall.
These are thing gold doesn’t like: 1. Rising real rates (bonds/Treasuries become a threat to gold which pays nothing; banks and other companies make more money with rising rates) and 2. Economic recovery with higher corporate earnings. Earnings drive stock prices higher. Stocks pay dividends that compete with bonds, and companies use cash to buy back stock, which drives up stock prices, while gold pays nothing.
In liquidity crunches (which the Fed is supposed to prevent) gold can drop with everything else but the US dollar.” As it did on Friday, the 21st of Jan.
What gold does mostly as I’ve written HERE is follow real interest rates around the world (if you own “gold in dollar terms” you care about U.S. rates most of all). The rest of the world does matter however, including massive buying by central banks. Real interest rates have been rising around the globe. Bad for gold.
GUIDE: “Remember GLD is being used as an indicator for the ECONOMY here.” If gold continues to rise again, it means the market believes real rates are going to fall or stay negative for a period of time.
Rate Signal: At this point Bearish for a further U.S. stock market rally, as rates have risen too quickly. The 10 Year Yield trend is short term Bullish, and intermediate term Bullish.
(Remember: higher rates mean lower bond and Treasury prices and vice versa). We want slowly rising rates in a recovering economy. That’s what happens normally. The Fed raises rates slowly as the economy continues to grow until it doesn’t. What we don’t want is rapidly rising OR rapidly falling rates, both of which I call “Rate Shocks.” We are currently experiencing a “Rate Shock” due to the Fed 1. Hiking Fed Funds rates and 2. Reducing the Balance Sheet.
Thank you for reading. Would you please leave your comments below where it says “Leave a reply”… or ask a question if you like…
Pay it forward by sending the link to MarketTiming.Blog (that link will immediately connect them to this webpage) to a relative or friend. Thanks for doing that.
Be sure to visit the website for more general investing knowledge at:
Standard Disclaimer: It’s your money and your decision as to how to invest it.
I thank Worden Brothers for the charting system I use to post these charts. If you want to know more about the charting system I use every day, contact me for any questions, or click HERE. Please use that link when you sign up as I am an affiliate (I don’t make much, but it may help to pay for some of my website expenses). It makes it much easier to follow along with me if you can see the charts and manipulate them on your own computer. It’s a great investment to have an excellent charting system.
Note: I’ve updated my criteria for the equity signal for a further U.S. stock market rally to the following: GREEN = Bullish, YELLOW = Neutral, RED = Bearish. In other words, the colors tell you whether the signal supports the stock rally or not, while the Bullish, Neutral, and Bearish designations are about the trend.
A BEARISH trend signal does not mean we should not buy. A BULLISH trend signal does not mean you cannot sell some exposure. It depends on what is going on in the economy and how oversold/overbought the market is at a given point whether the Bearish signal is to be sold or bought, sold on the next bounce, etc. and whether a Bullish signal is to be bought or if profits should be taken. A NEUTRAL trend signal does not mean the end of the Bull or Bear. It means to wait and look for possible subsequent entry points within the existing trend, Bull or Bear, but preserve capital if the entry fails. Our strong intention is to buy low and sell high. By the way, I will keep showing the prior orange “Trigger lines” in the IWM and GLD charts for now as reference points only; they have historical value for us from the post-2016 election period.
Copyright © 2022 By Wall Street Sun and Storm Report, LLC All rights reserved.

Thank you David
You are welcome Charles. Thanks for taking the time to say that…