A Market Timing Report based on the 5-09-2014 Close, published Sunday May 11, 2014
The SP500 Index (SPX, SPY) continues to annoy both Bulls and Bears by staying stuck within a fairly narrow range, unlike U.S. small caps (RUT, IWM) and social media stocks (e.g., Facebook and LinkedIn) that have been sold off very hard in a less than social way.
Here’s where small caps are vs. large (SP500):
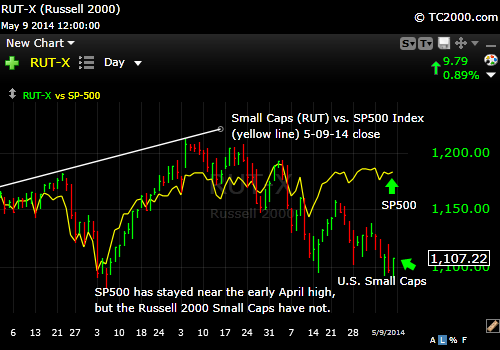
U.S. Small Caps are Diving, While SP500 Index Stays Afloat.
The SP500 could follow the small caps down if the Bulls give up here. That is what we are watching for. In fact, we’ve sold a portion of our holdings in the U.S. and are favoring overseas markets this year (click link below to see our positions) .
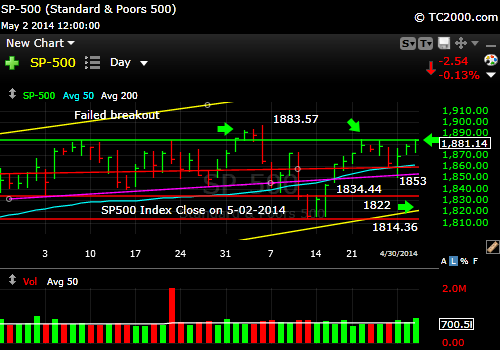
Here’s the SP500 Index Chart (click to enlarge):

SP500 Index stuck in a range for months.
There are several prominent support levels the Sp500 Index could pull back to if the Bulls don’t have what it takes to compel a new high and those are at 1857, 1830 and 1814 as noted on the chart above.
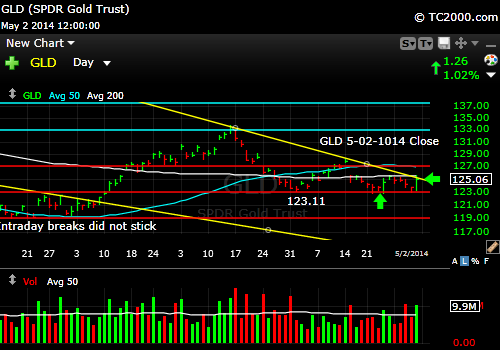
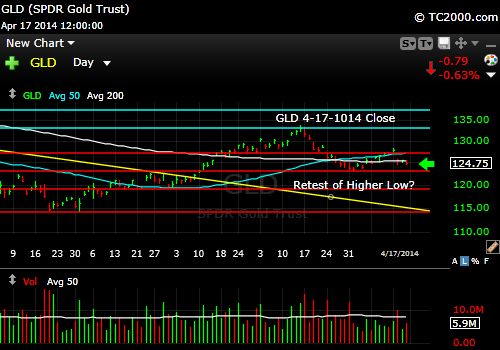
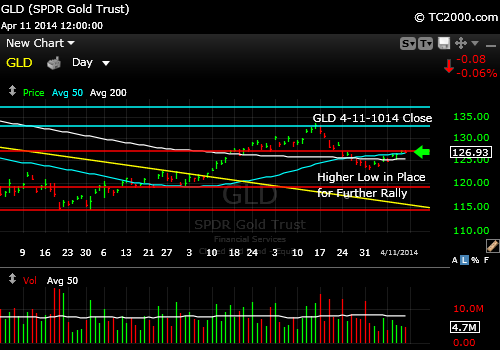
In the meantime, gold (GLD) is stuck as well, failing to charge ahead to make one new high after another as the chart shows (click to enlarge):
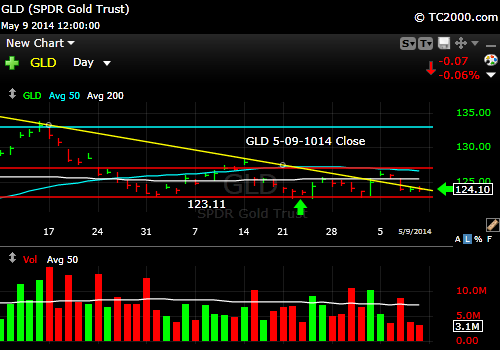
Gold is in a slump but holding a higher low for now.
Take a look at last week’s chart to see where gold could fall if the nearby support at the bottom red line does not hold. Gold has been contained in its rally, because part of the trade has been about Putin and the Ukraine, and the pressure ebbed a bit this week. So did gold.
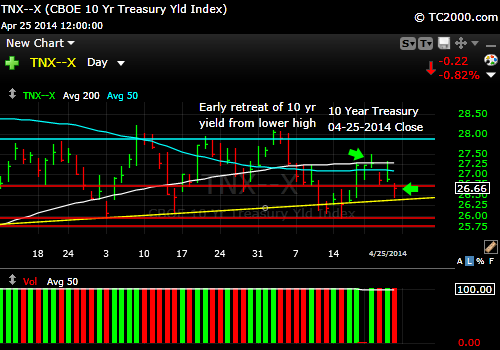
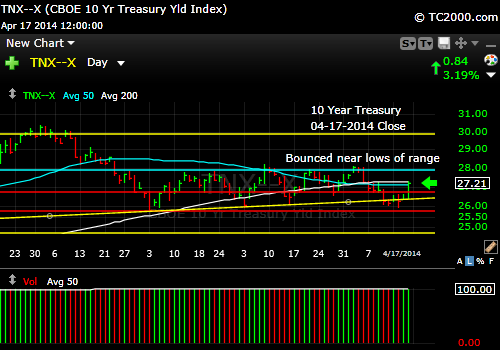
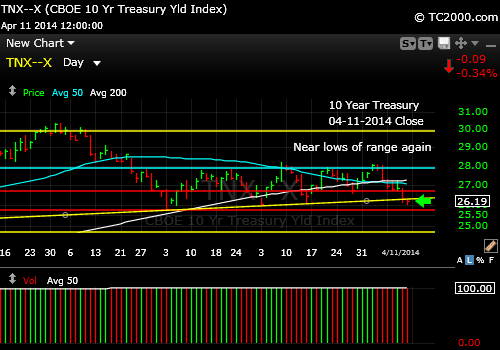
But the other issue is interest rates, so let’s look at U.S. government debt yields (10 Year Treasury Yield below) (click to enlarge):

10 Year Treasury yield bottomed during the more intense part of the Ukraine crisis (not over yet!), but ebbed this week when Putin backed off a bit.
The 10 Year Treasury has been bid up (yields go down) during the Ukraine crisis as well as gold, so when the 10 Year Treasury pulled up off of support, that pressured gold. Higher rates generally are great for gold. In order for higher rates to help gold, inflation would have to be on a strong tear and that is not the case. There IS inflation, and more than the Fed will admit to, but it’s not running that far ahead of the yield on the 10 Year Treasury.
Gold does well when there is not enough compensation for holding the 10 Year Treasury vs. the cost created by inflation. That is not happening quite yet. It may eventually occur and that threat should keep some sort of bid in gold as a hedge.
You can catch up on current AAII investor sentiment in this month’s issue of WSSSR™ (it did not change much since last week’s issue and it’s Bearish) and what it means in terms of a potential pullback, after you subscribe as well as learn what my market allocations are currently: Free Subscription to My Newsletter and access to my latest comments/strategy I’ll send you back the password to the access page and the weekly newsletter in the same email.
Standard Disclaimer: It’s your money and your decision as to how to invest it.
I also comment regularly on Twitter: Follow Me on Twitter
I thank Worden Brothers for the chart system I use to post these charts. If you want to know more about the charting system I use every day, go to my “Other Resources” page here: Other Resources It makes it much easier to follow along with me if you can see the charts and manipulate them on your own computer, so it’s a great investment to have an excellent charting system.
Look for updates this week as needed via Twitter.
Copyright © 2014 By Wall Street Sun and Storm Report, LLC All rights reserved.