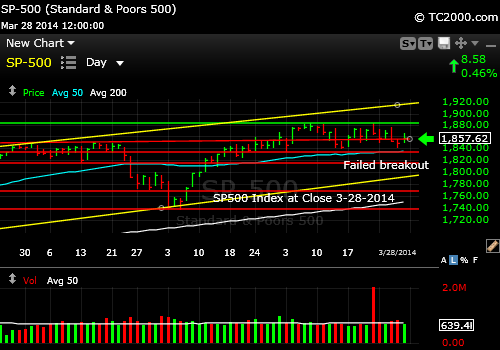
A Market Timing Report based on the 4-04-2014 Close published Sunday April 6, 2014
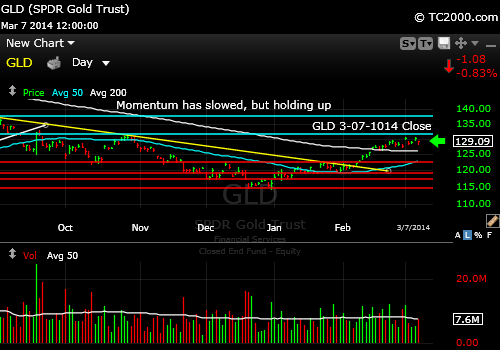
Gold finally rallied back enough that we could see a new leg up now. The pullback tried the weak hands, and kept in the more convicted traders and investors. But gold must maintain its momentum this week. The first resistance level is the 50 day moving average. And the chart below the gold chart shows that interest rates are supportive of gold moving up.
This fall in rates means the US dollar may not hold onto its new found strength. The only time the dollar tends to rally with gold over significant time periods are during times of panic in the world’s financial markets. Rates go down at the same time as investors pour into Treasuries. On Friday, that is not what happened (rates were down but the dollar was down as well and gold rallied.) The “Friday” scenario is good for gold. See my free issue for the rest of my signals (link below).
GLD chart:

Gold catches some support and could rally now.
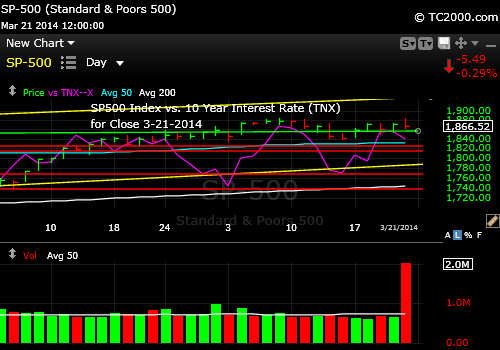
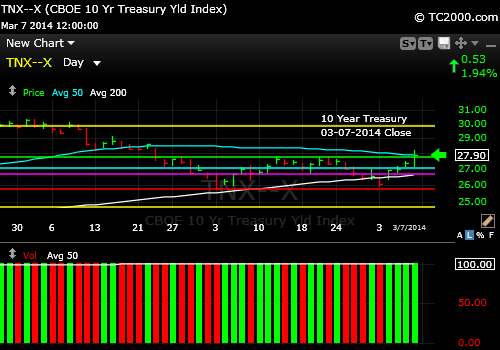
Ten Year Treasury Note Yield Chart (TNX, TLT, TBT):

10 Year Treasury Note stays in range.
To keep up with my latest thoughts on gold and interest rates on my access page, you’ll need the password, which you can get here (there is MUCH more on that page on all 18 major indices I follow):
Free Subscription to My Newsletter and WSSSR Access Page
Standard Disclaimer: It’s your money and your decision as to how to invest it.
I thank Worden Brothers for the chart system I use to post these charts. If you want to know more about the charting system I use every day, go to my “Other Resources” page here: Other Resources It makes it much easier to follow along with me if you can see the charts and manipulate them on your own computer, so it’s a great investment to have an excellent charting system.
Look for updates on the main chart tracking pages this week as I feel they are needed and comments via Twitter @SunAndStormInv (see link to upper right).
Copyright © 2014 By Wall Street Sun and Storm Report, LLC All rights reserved.