A Market Timing Report based on the 12-11-2015 Close, published Sunday December 13th, 2015
I deliver focused comments on the markets. These are supplemented with “Tweets/StockTwits” (see links below).
1. SP500 Index: I hope you followed my Tweets on Friday and if you agreed, took off at least a bit of exposure. Why? Because the VIX spiked above the level I had warned about: HERE It closed at 24.39, well above my target for a more serious sell-off. Is it a lock? Of course not. That’s why I simply reduced exposure a bit to raise some cash. The higher risk I perceived in the market this year also has me well below my prior equity exposure high of 135% vs my usual maximum level (that was reached with excess cash; you’ll need to determine your number based on multiple factors including age, need for cash etc. That’s why I only speak in relative terms; so you can tailor your exposure according to 1) whether you believe in what I’m suggesting in the first place and 2) your personal financial situation.).
Come Monday and Tuesday, the market could reverse course and rally leaving me behind in exposure. That’s the risk of leaning too far one way or another. My sense is that some Bulls are underestimating the damage that higher Fed rates could do with commodity prices (CRB index) falling to a SUB-1992 level (you read that right!). The other bad prognostic sign in that the Dow Transports are almost back to the August low already (see second chart below).
If the Fed ignores crashing commodities and calls the decline “transitory,” we are in BIG trouble and the markets could dive to brand new lows for 2015. Stay tuned for the “dog and pony show” at 2:30 pm ET on Wednesday Dec. 16th, after the release of the Federal Reserve’s FOMC statement.
What’s the Bear Crushing Option the Fed has? If the Fed raises 0.50% and says it’s done until proven otherwise, the stock market will rally hard.
SP500 Index Chart (click to enlarge; SPX, SPY):
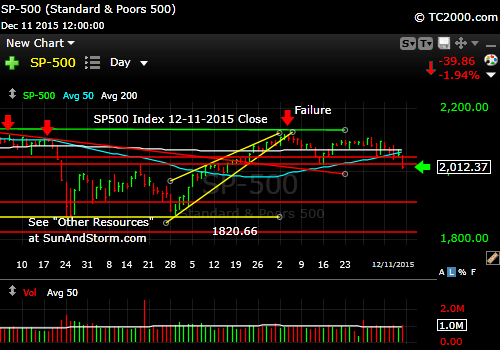
SP500 Index At Risk for a Drop to August Support
Dow Transports in major decline back to August low (DJT, IYT; click to enlarge):
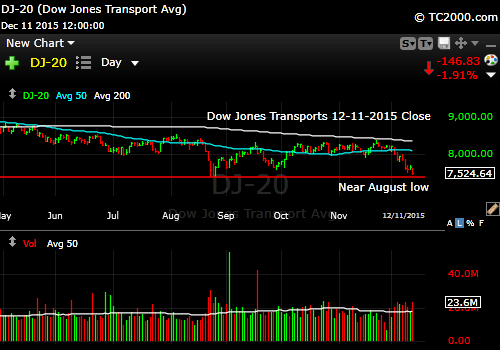
Transports in steep decline.
Keep up to date at Twitter and StockTwits: See my messages on Twitter® Follow Me on Twitter®. Follow Me on StockTwits®).
2. U.S. Small caps are headed back to the August low. They are not far from there at this point.
Russell 2000 U.S. Small Cap Index (RUT, IWM; click to enlarge):

Small caps slipping back to August low.
3. Gold is still hanging out BELOW prior major support DESPITE the fall in interest rates over the past week. The gold reversal UP was washed out, but gold has yet to signal the next move. We may be entering a “sell everything” period of raising liquidity. We’ll likely find out the next move in gold by the Weds. Fed announcement and news conference. If the Fed says “one and done” or something hinting at that, gold may spike as will equities.
Gold ETF (GLD; click to enlarge):

Gold still weak.
4. U.S. 10 Year Treasury Note Yield (click chart to enlarge; TNX,TYX,TLT,TBF): Rates are falling as the Fed is about to hike their rates. Although over the longer term. long rates can stay low or even fall with Fed rate hikes, the fall in yields is ominous at this point, given the crash in commodities. This may in part also represent a “flight to safety” from stocks.
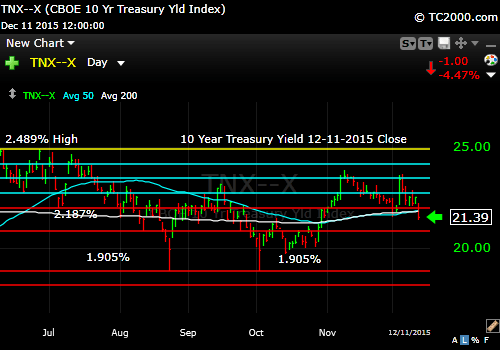
Rates are falling which is ominous in view of the fact that the Fed is about to raise rates.
Be sure to visit the website at: Sun and Storm Investing™
Standard Disclaimer: It’s your money and your decision as to how to invest it.
I thank Worden Brothers for the charting system I use to post these charts. If you want to know more about the charting system I use every day, go to my “Other Resources” page here: Other Resources It makes it much easier to follow along with me if you can see the charts and manipulate them on your own computer. It’s a great investment to have an excellent charting system. Check it out with a free trial at the link above.
Note that the newsletter is now CLOSED to new subscriptions: Join the Wait List to Join the Newsletter as a Loyal Subscriber, Opening again for the January 3rd issue. If you join and don’t read the newsletter, you will be deleted. Why? I don’t publish to non-readers as other newsletters do. I surround myself with committed people who value what we are doing. Stay tuned here in the meantime and follow all the action via the Twitter® and StockTwits® links above.
Copyright © 2015 By Wall Street Sun and Storm Report, LLC All rights reserved.
