A Market Timing Report based on the 5-13-2016 Close, published Sunday May 15th, 2016
I deliver focused comments on the markets. These are supplemented with “Tweets/StockTwits” (see links below).
1. SP500 Index: The SP500 Index fell below the yellow down trend line I’ve been pointing out after GOOD economic news including higher consumer sentiment and stronger retail sales than were expected (see my Twitter feed to the right/StockTwits link below). When “good news is bad,” it means the market may begin anticipating a June Fed rate hike or that the economy is weaker than the data just released would indicate. (See prior post for targets and the social media links for updates.)
SP500 Large Cap Index (click chart to enlarge; SPX, SPY):

SP500 could have more downside.
Survey Says! Sentiment fell back a bit this week among individual investors (AAII.com) with the Bull minus Bear spread at -10.9% this past Wednesday (Bulls 20.41% and Bears 31.29% with Neutrals a Bullish 48.30%; Neutral Scores > 40 are Bullish for markets rising 6 months out.). There is STILL no sentiment extreme from the perspective of the AAII data. The lack of a sentiment value in the range of prior major lows of -20% to -30% does not mean the market cannot rally. We are only 4.0% off the prior high of 5-22.2015. That’s right, we are down 4% from a high of about 1 full year ago, which is known as making no progress. Subtract off the dividends and it’s still a small loss for the 12 month period.
Please keep up to date at Twitter and StockTwits: See my messages on Twitter® Follow Me on Twitter®. Follow Me on StockTwits®).
2. Let me say every week until we see a break that the U.S. Small caps are STILL above the 1040.47 level that for me defines a Bear market transition point. Small caps did in fact follow the large caps down as predicted.
Russell 2000 U.S. Small Cap Index (click chart to enlarge; RUT, IWM):
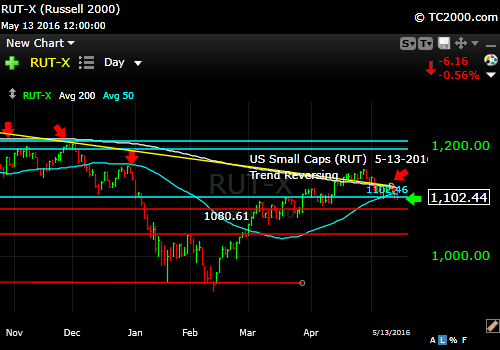
Small caps vulnerable again.
3. Gold: Gold is on pause, but held the up trend line despite US dollar strength In real panic, the gold up trend would resume while the dollar also rises. The U.S. and other developed nations are trading off in a range of currency weakness. The US dollar reached the bottom of the range “allowed,” and bounced. I am not saying it’s an outright conspiracy, but all the players are watching and protecting a range of currency strength.
Gold ETF (click chart to enlarge the chart; GLD):

Gold holding up, but needs to break out again.
4. U.S. 10 Year Treasury Note Yield (TNX): The Atlanta Fed now expects 2.8% GDP for Q2. I doubt it will happen. Their initial estimates were way off last time too (way too high; 2.6% guesstimate in Feb. vs. a 0.5% for the initial Q1 reading). Higher energy prices will help dampen losses elsewhere in the economy, but oil could be at the top of a range now. If oil falls from here, we could dip into recession by Q3.
U.S. 10 Year Treasury Note Yield (click chart to enlarge; TNX,TYX,TLT,TBF):

Rates still falling.
Stay with me throughout the week for the LATEST via the links to Twitter/StockTwits above. Feel free to comment, retweet etc. to spread the word.
Be sure to visit the website for more general investing knowledge at:
Standard Disclaimer: It’s your money and your decision as to how to invest it.
I thank Worden Brothers for the charting system I use to post these charts. If you want to know more about the charting system I use every day, go to my “Other Resources” page here: Other Resources It makes it much easier to follow along with me if you can see the charts and manipulate them on your own computer. It’s a great investment to have an excellent charting system. Check it out with a free trial at the link above.
Note that the newsletter is now CLOSED to new subscriptions: Join the Wait List to Join the Newsletter as a Loyal Subscriber, Opening again for the July 3rd issue. If you join and don’t read the newsletter, you will be deleted. Why? I don’t publish to non-readers as other newsletters do. I surround myself with committed people who value what we are doing. Stay tuned here in the meantime and follow all the action via the Twitter® and StockTwits® links above.
Copyright © 2016 By Wall Street Sun and Storm Report, LLC All rights reserved.
