When Does Gold Shine and When Does it Decline? The “Secret Formula” for Successful Gold Market Timing.

“What makes gold work as an investment and when does it become a portfolio disaster?”

(Written 5-11-2015 and Updated 2-15-2022)

When Does Gold DECLINE?

Let’s handle the “bad news” first.  I said in my update of last week’s blog post: “Gold is not a good trading idea if the economy is indeed going to improve dramatically.”

If the economy is booming, stocks are rising rapidly, interest rates are rising ahead of inflation keeping real rates positive and rising, and the U.S. dollar is strong, gold does horribly.  You don’t need dollar insurance when the dollar is rising, and you don’t need to protect yourself against a decline in stocks when the economy booms for years in a row.  That’s why gold was a horrible investment in the 1990s.  There was a huge economic boom, despite the bust to follow.

Gold competes with forms of yield whether it’s stock returns by price appreciation, stock yields, or Treasuries, bonds, and other interest rate bearing assets. Gold tanked in the late 1990s, because stocks were the best place to make money.

When Does Gold SHINE? 

In economic terms, there are three “secret” ingredients needed for gold (GLD; gold ETF) to shine and two corollaries.  They are secret if you don’t know them!  This is essentially the flip side of what I just said above about when gold declines, but I spell out the details, so they’ll sink in better…

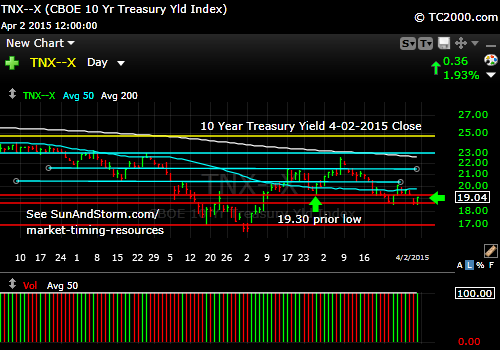
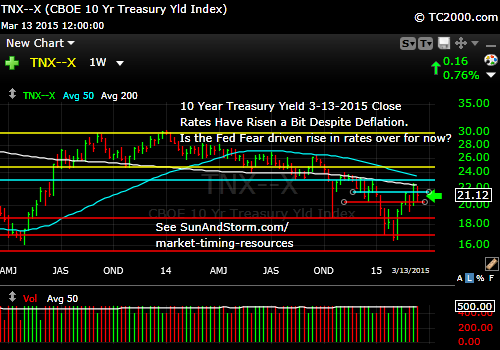
First, gold does best with negative and falling real interest rates, which means inflation above the rate of return of interest bearing instruments like bonds (10 Year Treasury Note (TNX), 30 Year Treasury Bond (TYX), corporate bonds (LQD) etc.).  The rate of change of real interest rates can accelerate a move in gold prices as the market perceives that as a threat to price stability in either direction.

A rapid rise in rates generally will hurt gold and a rapid fall with generally help it, though not necessarily in a stock market crash.  When a crash occurs investors need liquidity, so they may sell everything, even gold.  In addition, Treasuries generally compete with gold during stock market declines of 15%+, because they have a real yield, and the U.S. dollar is often strong.  Stocks are sold.  Dollars are received.

During the COVID-19 Crash gold fell at first with Treasuries rising.  Then gold rallied off the March low and U.S. Treasuries fell off their March 2020 high.

To clarify this further, falling real interest rates help gold, but falling real rates with already negative real yields on U.S. Treasuries helps gold even more.  Why?  Because gold has a ZERO yield unless you loan it to someone.  If you hold it, you are making ZERO.  You own gold to preserve the value of your assets, which melt away if held in U.S. dollars in a bank giving you a negative real yield (a yield lower than inflation).  When yields are already negative, you can just sit in gold, even if real yields are not falling further, and you are still being protected vs. holding dollars.

Note, however, if real yields are rising, gold owners will tend to anticipate positive real yields to come and will tend to sell gold, even if real yields are still negative.  

Summary of the Real Yield Impact on Gold: Buy gold when real yields are falling and especially when they are both negative and falling.  Sell gold when real yields are rising and especially when they are both positive and rising, which is typical in an economy with accelerating GDP growth.

I could have listed “Falling Stock Prices During Economic Slowing with Falling Real Yields” as a factor, but it can be seen as a dependent factor vs. real yields. 

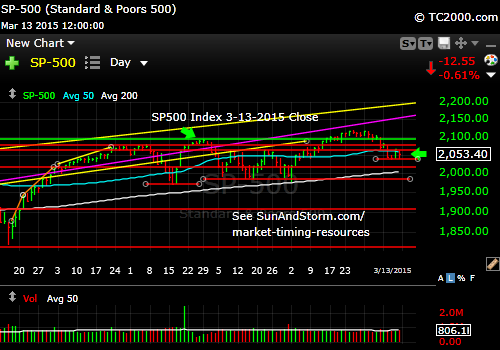
If stock prices are rising and real yields are also rising, gold does poorly.  Why?  That’s generally when the market’s rise is most powerful and sustained.  Stocks compete away interest in gold.  

Remember though that both stocks and gold can do OK if real yields are falling while economic growth is accelerating.  Falling real yields win out over rising stock prices and push gold higher.

On the other hand, when the economy is slowing, investors will sell stocks as they fall with their earnings.  Economic slowing helps gold if real yields are falling due to either 1. Inflation rising faster than interest rates during Stagflation (slowing economic growth and inflation) or 2. Deflation (slowing economic growth and deflation).

“Insurance Gold vs. Trading Position in Gold: Regardless of any of the factors discussed, you may choose, as I do, to hold some gold as a hedge at all times vs. various disasters.  What I don’t do is hold a trading position in gold on top of my “insurance gold,” when the factors discussed here are working against the gold priced in U.S. dollars.  (If you live abroad, simply adapt this to your own currency and interest rates.)

How much insurance gold should we own?  Many say 5% but don’t state whether that is vs. net worth or investable net worth, so take your pick.  Others say 10%.  To me that is too high.  I use 5% of total net worth.  Where I rebalance to 5% depends on the gold chart.

Why not sell everything you own, including “insurance gold,” when conditions for gold deteriorate and then buy it all back when they improve?  Remember, if you sell a long term holding in gold, you have to pay 28% capital gains at the long term income tax rate (same for GLD).  It’s a collectible unless you use a derivative ETF as a substitute, which has its own issues.  Plus, how do you time the need for insurance, when a sudden event like a tsunami can occur and create financial panic.  It happened in Thailand.  It happened in Japan.

On to the next important factor in helping gold shine…

Second, gold also does well when the currency it’s measured against goes down, not up.  When the economy is weak, the Federal Reserve lowers the Fed Funds rate and longer rates fall as well leading to falling real interest rates.  Those falling real rates drive down the dollar.  Foreigners sell U.S. dollars.  A weak U.S. dollar (expressed as the US dollar index) makes gold more valuable to U.S. citizens, because it then takes more dollars to buy it.  A trend in this direction increases demand,  speaking of which…

Third, gold goes up when it’s in demand worldwide.  Demand means total trading demand worldwide, so gold naturally does best when it is rising in market timing terms in multiple important currencies worldwide than when it is just performing well in one currency.  If gold is rising in multiple major currencies including the U.S. dollar, the Euro, the Yen, and the British pound, for example, gold often continues to do well. That condition would occur in a global economic slowdown with numerous key central banks lowering short rates.

This means that the trend itself is important, and to that extent, you need to do market timing of your investments in gold.  Yes, gold often goes up, because it’s going up over a period of time that convinces the market that gains will continue.  This means it can be overdone to the upside at times, and corrections ensue for example, as real interest rates change, or demand falls due to greater worldwide financial stability.

It is theoretically possible for influences like advertising to cause gold prices to rise.  A big systemic shift in what financial advisors say about gold’s value as insurance or as an investment would help or hurt the price of gold.

A currency-driven financial panic can have a big effect on gold prices as we saw when the Euro seemed in peril.  In that situation, the U.S. dollar AND gold can do well.  They are both in high demand during a panic out of Euros.

The ideal environment for owning gold (GLD) is: 1. Negative and falling real rates of return on Treasuries and bonds  2. A weak dollar.  3. Sufficient demand worldwide vs. supply with rising prices in multiple major currencies.

Corollaries of Point #1:

A. If stock prices are rising and real yields are also rising, gold does poorly.

B. Negative real yields, even better when real yields are falling, win out over rising stock prices and push gold higher.  

Supply is not a big issue with gold, because the supply is constrained by its rarity.  It could have an influence if there were a lot of gold selling all at once as it is always in the end supply vs. demand as with anything else that is bought and sold.

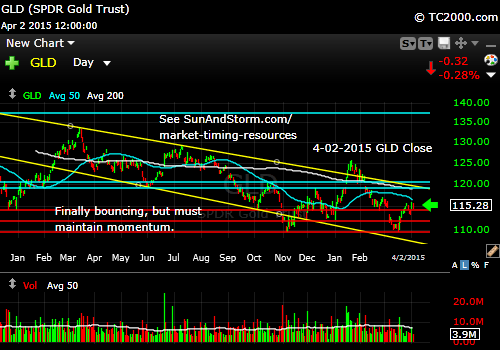
This analysis pertains only to this post, but is a good example of applying the above rules: Gold has been weak because “1” (see above) has been lacking with rising real interest rates, “2” is missing, i.e., the dollar has not been weak enough, and “3” the world is not in panic mode, so demand for gold has fallen globally.  The weak dollar has been the main force preventing lower lows in the gold price.  Gold is a hold as “insurance” in our long term view of gold as U.S. dollar insurance, and we have no trading position currently.

For now, if the economy remains sluggish, gold will do fine IF rates resume their fall and IF negative real rates prevail, while the dollar does not strengthen dramatically, which it should not if rates are falling, and the world is not in “Euro panic” mode.

If you read this at a later date, just apply the principles the same way we are doing here with the current facts.  They will help you make a better decision on whether to buy or sell gold.

If you appreciated this post, please say so below in the box labeled “Leave a Reply” and post it to Facebook or other social media. 

Thank you for using your valuable time to make a comment.

To find out what I’m doing, including buys and sells, please follow me here: Follow Me on Twitter®.   Follow Me on StockTwits®   You don’t have to make comments yourself to read my messages.

I cover foreign markets on social media (see links above) and in my monthly newsletter.  Note that the newsletter is now closed again to new subscriptions: Join the Wait List to Join the Newsletter as a Loyal Subscriber, Opening again for the July 5th issue.  If you join and don’t read the newsletter, you will be deleted.  I don’t publish to non-readers as other newsletters do.  Stay tuned here in the meantime and follow all the action via the Twitter® and StockTwits® links above.

Be sure to visit the website at: Sun and Storm Investing™

Standard Disclaimer: It’s your money and your decision as to how to invest it.

I thank Worden Brothers for the charting system I use to post these charts.  If you want to know more about the charting system I use every day, go to my “Other Resources” page here:  Other Resources   It makes it much easier to follow along with me if you can see the charts and manipulate them on your own computer.  It’s a great investment to have an excellent charting system.  Check it out with a free trial at the link above.

Copyright © 2015 and 2022 By Wall Street Sun and Storm Report, LLC All rights reserved.

Posted in Bonds, gold, investment, Treasuries | Tagged , , , , , , , , , , , , , , | 3 Comments

Market Timing Brief for the 5-01-2015 Close with 5-10-2015 UPDATE: Stocks Falter at a High. Gold Loses Some Luster. Rates Rising But Nearing Resistance.

A Market Timing Report based on the 5-01-2015 Close, published Saturday May 2nd, 2015

I deliver extremely FOCUSED comments on the markets.  These are supplemented with “Tweets/StockTwits” (see links below).

UPDATE 5-10-2015:

Dr. Yellen, our esteemed Fed Chair said U.S. stocks were overvalued in comments she made this week.  The market reacted by rallying much as they did following Alan Greenspan’s similar “over-exuberance” comments.  I am seeking to buy individual well valued companies vs. indices where I can, but I do have index exposure too.  I’ve hedged some of that by selling options, which helps add income even when stocks trade in a sideways manner.

SPX (SP500 Index): Up against resistance already.  Not a great place to buy.  We did some buying just before the jobs report, which was worthwhile (see Twitter®/StockTwits® Links below).  The range is more narrow, so you have to buy the bottom quickly or it just does not pay.

RUT (US Small caps): Better buying position, but lagging the large caps in the face of U.S. dollar weakness.  And much more overvalued than large caps.  We have very little exposure to small or mid caps currently.  Risk works better early in Bull markets than late, because you are making money rather than losing it in declines!  It is called “beta.”  When you buy a stock like LinkedIn that shot up 10.69% on 2-6-2015, know that that “beta” means it can decline that or more (18.61%) on 5-1-2015.  We can’t avoid all such losses, but remember this and you will save yourself a lot of heartache: Risk up means risk down. 

GLD: Gold recovered from some recent weakness, but barely.  Not a good bet if the economy is indeed going to improve dramatically. If the economy remains sluggish, gold will do fine as rates resume their fall. 

TNX: The 10 Year Treasury hit the March high and fell, so the Bond Bulls may get some traction now.  Falling rates would help gold hang on. 

Emerging Markets:  I expect rates to fall for a bit (if not, stand this on its head), which emerging markets (EM) like.  They like loose, plentiful money lending.  I dialed back my China exposure (see Tweets/Twits) to 75% of my usual maximum exposure for EM with 70% in China and the rest in India.  I won’t like China if FXI closes back below the 4-17 low.  I’d like to see proof that the market really believes that the government is going to do something about getting the economy back on track.  Imports were down 16% this past reporting period, which is a sign of slowing.

Europe:  We saw a nice pop in our EWU position on Cameron’s re-election and the British economy is strong enough with a stronger currency now as well vs. the USD.  It’s not a great point to buy this market as it’s at a double top.  I don’t love chasing, but if you have to, this may be one that will work out.  It’s better to buy the pullbacks in Bull trends as we did with the U.S. market this week.

Stimulus by European, Chinese, Japanese, Australian, and other central banks certainly can help U.S. multinationals to grow, but the issue is whether that will be enough.  That’s yet another reason why we are focusing on buying pullbacks.

Now back to last week’s charts…..

Current Thinking and Market Timing:
– German rates rose rapidly this week (last week rates were negative out 8 years for Germany; this week rates are negative out to 5 years), indirectly pressuring U.S. rates.  Our market seems to believe that all is well and the Fed will continually raise rates, but the data does not clearly support that.  Rates are still very low in Europe, despite the move up this week, and the low rates should STILL help out the Eurozone economy.  So we’re staying put (see last week’s post).  If you buy into Europe, I would recommend hedging half of your holdings and not hedging the other as detailed in the prior post.

China (FXI): Looking toppy, so I removed leverage, which was previously as high as 50% near the top.  We still have 100% exposure to emerging markets mostly via China, but some via India.

– Last week I said: The dollar is looking toppy now (there is a “but” there….keep reading)…”  This week the dollar up trend was broken.  Where it inflects will depend on news flow.

The dollar is saying that the Fed WILL NOT raise rates that soon, or that as it does, inflation will get out of control.  Unfortunately, the dollar/rate signals are not crystal clear as rates are rising as the dollar falls, which one would expect only if A) The Fed were going to steadily raise rates until they hit 4-5% thereby crushing the economy or B) If inflation fears were rising and the Fed were in fact behind the curve as expressed in the bond market.  The data do not currently support the idea of rampant inflation.  The Fed appeared to be on track on the inflation front in 2014, but that fell apart in 2015 as the data here shows: Inflation Stats.

– The Fed cannot raise interest rates any time soon due to its two mandates.  Employment slowed last month, so next Friday’s number is key.  If U.S. employment is too strong, look for a sizable market correction.  Assuming employment remains sluggish, the Fed also has to meet it’s circa 2% inflation goal, which is it not being met. 

If you have not yet read the post on what normally happens to the markets when rates rise, please see that post link in the right column. 

If you like what you just read, please show your gratitude in a tangible way as many of you do, as in Tweeting the link to this article, writing a comment below that is meaningful, or writing a testimonial in the comments below about how you’ve made money based on my insights.  Thanks for taking the time to do that!

And now the charts for the week:

SP500 Index (SPX, SPY; click the chart to enlarge it): I said I expected the first two red lines to provide support this week and they did. If you look at the overall formation it is an ascending triangle, which is Bullish.  To capitalize on this, the market needs to quickly break out to a brand new high.

sp500-index-market-timing-chart-2015-05-01-close

To find out what I’m doing, including buys and sells, please follow me here: Follow Me on Twitter®.   Follow Me on StockTwits®   You don’t have to make comments yourself to read my messages.

Russell 2000 U.S. Small Cap Chart (RUT, IWM; click the chart to enlarge it):  You can see the up trend break, and the relative underperformance vs. the large caps of late.  Small caps had risen in part based on their relative outperformance vs. large caps due to U.S. dollar strength, which hurts U.S. large cap multinationals more than small caps.  That influence is reversing now as mentioned (dollar down).

rut-small-cap-russell-2000-index-market-timing-chart-2015-05-01-close

Small caps are slipping. Held a support level. Another bounce and slip due?

The Gold ETF Chart (GLD; click to enlarge the chart): (see above and below for predictions): Real interest rates were rising last week with low inflation and rising rates, which always hurts gold.

gld-gold-etf-market-timing-chart-2015-05-01-close

Gold slipping once again despite dollar weakness on rising rates.

U.S. 10 Year Treasury Yield Index (Please Click the TNX Chart to enlarge it ; see related ETFs: TLT (a 20 year ETF), UBT (2X TLT and TBT inverse 2X TLT): Just when it looked as though rates could keep breaking lower, they reversed UP, but are just about to hit some resistance.  What will support a continuation of this?  A strengthening economy.  Rates will rise if the U.S. economy strengthens and creates more demand, which causing rising prices eventually.  Wages also rise in a healthy economy and stay ahead of inflation.  That is called prosperity, and it does not just touch the top 1%, when the economy is inventive and productive.

If the economy is in fact slowing, the Federal Reserve won’t be able to raise interest rates, and they are likely to fall with further easing measures or persistently low rates. 

tnx-10-year-treasury-note-market-timing-chart-2015-05-01-close

Rates rising again. A yo-yo under a Fed spell.

I cover foreign markets on social media (see links above) and in my monthly newsletter.  Note that the newsletter is now closed again to new subscriptions: Join the Wait List to Join the Newsletter as a Loyal Subscriber, Opening again for the July 5th issue.  If you join and don’t read the newsletter, you will be deleted.  I don’t publish to non-readers as other newsletters do.  Stay tuned here in the meantime and follow all the action via the Twitter® and StockTwits® links above.

Be sure to visit the website at: Sun and Storm Investing™

Standard Disclaimer: It’s your money and your decision as to how to invest it.

I thank Worden Brothers for the charting system I use to post these charts.  If you want to know more about the charting system I use every day, go to my “Other Resources” page here:  Other Resources   It makes it much easier to follow along with me if you can see the charts and manipulate them on your own computer.  It’s a great investment to have an excellent charting system.  Check it out with a free trial at the link above.

Copyright © 2015 By Wall Street Sun and Storm Report, LLC All rights reserved.

Posted in Bonds, gold, investment, large cap stocks, S&P 500 Index, small cap stocks, Treasuries | Tagged , , , , , , , , , , , , , , , , , , , , , , , | Leave a comment

Market Timing Brief for the 4-17-2015 Close: Stocks Correct in Their Up Trend. Rates Are Falling. Gold is a Trade and Insurance.

A Market Timing Report based on the 4-17-2015 Close, published Sunday April 19th, 2015

UPDATE for the Big Markets We Follow Published 4-26-2015 (Update 2 on a subscriber email is below these comments…)

SP500 Index: stopped at 2117.69 on Friday, barely below the prior 2-24-2015 high of 2117.94.  This is a possible pivot point up or down and not a great place to buy.

Russell 2000: Stopped at 1267.54, just below the 3-27-2015 high of 1268.16.

Both large and small cap stocks are testing just below major highs.  This is a pivot point, so if you intend to trade it, follow the move, up or down.  I remain Bullish over the intermediate term of 6 months, because I expect the world economy to continue to strengthen and help the SP500’s  performance despite the U.S. dollar, so investors who don’t like trading may choose to stand pat and take their lumps should we shift into a correction.

As I messaged on Twitter®/Stocktwits® this week (see links below), sentiment remains supportive of a Bull case for the coming 6 months, because a large number of investors are neither Bullish nor Bearish (read at the link in the Tweet).  SPX earnings are beating ESTIMATES, but earnings are lower than the prior year’s Q1, and revenues are coming in light: Revenues light, earnings beat lowered expectations

That means the article at the prior link is a bit of baloney frankly.  Earnings FELL year over year and now they are beating LOWERED expectations.  The story sounds a lot different when you know the facts.
Multinationals remain challenged by the strong U.S. dollar.

Gold ETF (GLD): Broke the 113.41 low of 3-31-2015.  My view?  More downside to 111.95ish or prior March or November lows.  I still like GLD as insurance, but we’re not in a trade right now.

10 Year Treasury Yield: Back below 1.930%, so headed to test the base of the current range at 1.843%.  Bullish for bonds.

We’ve got both the Fed and GDP for Q1 2015 this Weds, so plenty of explosives on hand to send the stock markets higher or lower.

UPDATE 2 at 10:11 am 4-27-2015:  I received this note from Don and wanted to comment.  See my answers in bold/brackets.

Hi David,

I just wanted to write a quick note to thank you for your excellent insight and commentary on the markets. I’m a new subscriber (just received my first monthly newsletter a few weeks ago) and I’m really enjoying learning from your insights.  <Glad you find it valuable!>

I’ve noticed recently that a larger than normal number of “experts” on CNBC seem to be pulling back, anticipating a possibly substantial correction in the U.S. markets. <They are continually finding people who will be contrary to what the market is doing, because that is what makes for better TV, but not necessarily better investing.  Follow the key information on what is actually happening, rather than the latest opinion that is not based on facts, but just “worry.”   Worry will get you out of the market too soon in many cases, and keep you out when you should be back in. >  For that reason, I’ve been investing in DXJ, DXGE, and EWU, but I’m still overweight U.S. equities, mainly tech stocks. <Unless you are sure as to where the US dollar will go, I recommend that you balance dollar hedged vs. non-hedged ETFs.  If you are good at currency trading, by all means, pick one over the other. >My portfolio has done well, beating the S&P by about ten points<Fantastic results, hopefully in a tax-free setting of course if you are buying and selling a lot, or those gains get trimmed, but very well done regardless!>, but I’m wondering what you’d advise. I am a faithful reader of Investor’s Business Daily and so follow the tenets of William O’Neil by carefully watching the moves of the big institutional traders. IBD recently moved into a “Confirmed Uptrend” view of the markets based on institutional buying patterns<IBD is one of the better sources of information and perspective, though I don’t personally follow them at this time.  I do like Bill O’Neil’s book “How to Make Money in Stocks” but don’t use stops that are quite as rigid as he does.  I believe stops should vary with volatility.  Using the same % stop on every ETF/stock does not make sense in my view.>.

I do have a question for you: You say you’re bullish in the intermediate term, but are you neutral in the near term? I couldn’t determine your outlook by your comments in your most recent weekly update.<You actually just stated my view.  I’m short term neutral on the market (a pivot point is neutral really, not a place to buy or sell, but perhaps to hedge a bit of your gains if you know how to do that (see Tweet from this morning at link below or on sidebar of this site) or to take some profits and ride the rest, but I’m Bullish for the 6 month period for reasons that I’ve stated (why go too far ahead in time really?  It’s all guesswork and nonsense.  Even the Fed has no clue what the conditions will be in 6 months.  Their forecasts are notoriously bad.  My guess?  Economic conditions will not be that bad given all the monetary stimulus being supplied by central banks around the world.)

Thanks again for your wonderful newsletter. I’m an appreciative subscriber!

<Glad to have you on board as a “Loyal Reader”!  Keep sending your comments Don.  In the end, follow YOUR OWN conclusions, and you will do well, as you have.  Be flexible and willing to change your mind, but not too willing (over-trading most often results in lousy returns!).>

Kind regards,

Don Barton

Standard Disclaimer: It’s your money and your decision as to how to invest it.

back to last week’s charts and commentary….

I deliver extremely FOCUSED comments on the markets.  These are supplemented with “Tweets/StockTwits” (see links below).

Current Thinking and Market Timing:
– There are many who believe the Fed cannot raise rates until early 2016 now.
European rates are negative out many years (8 for Germany), so the pressure to invest in European stocks will be high for Europeans for a while to come.   This will pressure their stock markets higher.
– Stick with EWU if you own it.  It’s off it’s lows now.  Not a great buy here as it has run up from the recent low (you’ll have to buy a low in the up trend; we’re holding current positions).  It will benefit from the stronger European economy, and the pound should hold up better now.
For new European positions (in this case EuroZONE…), I’d buy Germany (see below for how to avoid currency exposure – unless you WANT some currency exposure!).
China just announced Sunday that they will allow banks to further cut reserves to bolster their economy that threatens to fall below the target of 7% growth. It’s the second cut in 2 months per @CNBCStick with FXI for now.  Decide where you’ll preserve profits of course, but don’t set an ultra tight stop.  I believe there was an overreaction on Friday to the announcement that the Chinese were going to allow more short selling in their markets.  The weakest hands fled the market.  Our hands are not weak, but we’re also not stupid, so we will apply some reasonable stop to preserve at least, say half our profits, correct?  It’s your decision, not mine.
The dollar is looking toppy now (there is a “but” there….keep reading) and with the Fed being put off potentially by several months if not much longer, the dollar could weaken further on the margin.  That’s why I’d hedge your European holdings with an equal amount of hedged vs. non-hedged ETFs (e.g. EWG plus DXGE).  That way, you don’t have to guess which way the Euro will go vs. the dollar.  If you are sure the Euro will fall to 0.85, then by all means overweight the hedged ETFs like HEDJ over VGK and DXGE over EWG for example.  Look at a chart of UUP, and you’ll see it’s on support, and if it holds there, the dollar up trend will remain intact.
Rates are falling again in the U.S.  See the chart below (TNX).  This makes stocks a good relative value over the intermediate term.
Longer term Treasuries will continue to rally (TLT, TYX). That’s the trend and the short term trend is also down in yield (TLT UP).  I admit that in the ultra-short term, we must break the current yield support (see chart) to continue the down trend on an immediate basis.  Stop buying into the BS sold to you by the mainstream press and read the truth about the “risk of rising rates” here: “What Actually Happens When Rates DO Rise…”
Gold is rising in a long term down trend.  Keep that in mind. You are now in a trade until the big trend changes.  (We are not in that trade, but I’ve commented that gold at least can be held as insurance and buying some would not be a bad idea if you hold zero currently.  Many advisors recommend 5% gold, but don’t say what the denominator is (investable assets [not including real estate] vs. all assets).  I say 5% of investable assets is reasonable.  Real estate is an inflation hedge at this point too, since it’s still fairly cheap, despite recent gains (not for all locations obviously; if something is overvalued due to speculation, it’s not a hedge).

Why am I not trading gold?  No great reason, other than the fact that the yield is zero and the fact that there are many complicating factors for gold not the least of which is the impending speeding up of the world’s economy, never great for gold unless inflation starts rising faster than interest rates (persistent negative real interest rates).  I think Chinese stocks are a better investment than gold right now (buy the pullbacks, not the “rips”).

If you like what you just read, please show your gratitude in a tangible way as many of you do, as in Tweeting the link to this article, writing a comment below that is meaningful, or writing a testimonial in the comments below about how you’ve made money based on my insights.  Thanks for taking the time to do that!

And now the charts for the week:

SP500 Index (SPX, SPY; click the chart to enlarge it): My sense is that the first two red lines will hold this pullback, but it really depends on earnings flow and forward guidance.  I don’t control that.  ; )

sp500-index-market-timing-chart-2015-04-17-close

Correction in Bull Trend

To find out what I’m doing, including buys and sells, please follow me here: Follow Me on Twitter®.   Follow Me on StockTwits®   You don’t have to make comments yourself to read my messages.

Russell 2000 U.S. Small Cap Chart (RUT, IWM; click the chart to enlarge it):  Small caps will fall about twice as fast as large if the correction deepens.  That’s called “beta.”  You see in the chart below that the channel breakout to the upside failed TWICE.  This is a correction in an up trend though, so be ready to use some cash if we get a bigger pullback than we’ve already had.   Your first add could be at the 50 day moving average or slightly below that if we get there.

rut-small-cap-russell-2000-index-market-timing-chart-2015-04-17-close

Small caps correcting a bit as well in Bull Trend.

The Gold ETF Chart (GLD; click to enlarge the chart): (see above and below for predictions):  This “trade” is slightly above mid-range in the channel, but I’d use the red line for a stop if I were to enter here (see above for why I’m not bothering beyond “insurance” when it comes to gold).

gld-gold-etf-market-timing-chart-2015-04-17-close

Gold has formed at least a temporary low and is rising in its downward channel.

Please Click the TNX Chart to enlarge it (see related ETFs, TLT, UBT and TBT): The 10 year yield did in fact fall back below 19.30 as predicted.  We’re at support, and we need a break below support.  My guess?  It will happen this week, so we’re staying long TLT.

tnx-10-year-treasury-note-market-timing-chart-2015-04-17-close

Rates are still falling in their longer term down trend.

I cover foreign markets on social media (see links above) and in my monthly newsletter.  Note that the newsletter is now closed again to new subscriptions: Join the Wait List to Join the Newsletter as a Loyal Subscriber, Opening again for the July. 5th issue.  If you join and don’t read the newsletter, you will be deleted.  I don’t publish to non-readers as other newsletters do.  Stay tuned here in the meantime and follow all the action via the Twitter® and StockTwits® links above.

Be sure to visit the website at: Sun and Storm Investing™

Standard Disclaimer: It’s your money and your decision as to how to invest it.

I thank Worden Brothers for the charting system I use to post these charts.  If you want to know more about the charting system I use every day, go to my “Other Resources” page here:  Other Resources   It makes it much easier to follow along with me if you can see the charts and manipulate them on your own computer.  It’s a great investment to have an excellent charting system.  Check it out with a free trial at the link above.

Copyright © 2015 By Wall Street Sun and Storm Report, LLC All rights reserved.

Posted in Bonds, gold, investment, large cap stocks, S&P 500 Index, small cap stocks, Treasuries | Tagged , , , , , , , , , , , , , , , , , , , , , , | Leave a comment

Market Timing Brief for the 4-02-2015 Close: U.S. Employment Loses Steam. U.S. Stock Futures Fall.

A Market Timing Report based on the 4-02-2015 Close, published Saturday April 4th, 2015

UPDATE 4-13-2015: There will be no publication this weekend.  Celebrating “tax week” with the rest of you and re-accessing future offerings going forward.

MY CONCLUSIONS FROM LAST WEEK

Last week I said: “I’ll go out on a limb to say that:

– stocks (SPY, SPX) will rise a bit this week off the higher low formed at the end of this past week along with a

Right.  The SP500 Index did rise a bit as shown in the chart below.

– stronger U.S. dollar

Right.  The U.S. dollar was up slightly.

– weaker gold

Wrong.  Gold was up fractionally.

– falling interest rates (rallying Treasuries and bonds).”

Right on TNX, the yield on the 10 Year Treasury, but wrong on TLT, which was down a bit.  TLT tracks longer maturity Treasuries (17.05 years per Morningstar)I think we’ll have further gains in TLT by Monday.

Why should we see a rising TLT and falling rates?  At 8:30 am on Friday we found out that only 126,000 jobs were created last month, far fewer than the 247,000 expected by Bloomberg.  That suggests that the Fed won’t be able to raise rates as early as expected.  It also suggests that stock prices may be too high.  U.S. futures fell about 1% after the announcement.  We’ll see where they open Monday. We could be in for a few rocky days.

Of note is that there is now room for the Fed inaction and stock futures still fell knowing that (futures were open, while the cash market was closed all day Friday), so it’s not all about the Fed any longer if we see selling continue over the next week.  Perhaps the economy will have to stand or fall on its own for the first time in years.  The Federal Reserve seems hell-bent on raising rates a bit, perhaps 25-50 basis points (0.25-0.50%) to get off zero rates.

Since the rest of the world’s growth seems to be improving marginally here and there (e.g. Eurozone, China and Korea), U.S. growth will be helped.  A further fall in U.S. Treasury rates will draw more money out of the U.S. dollar (down dollar), which would then help U.S. multinationals improve their sales.  The U.S. stock markets should recover in time despite a temporary setback in Q1.

And now the charts for the week:

SP500 Index (SPX, SPY; click the chart to enlarge it):

sp500-index-market-timing-chart-2015-04-02-close

SP500 Index rallies a bit off the prior low.

To find out what I’m doing, including buys and sells, please follow me here: Follow Me on Twitter®.   Follow Me on StockTwits®   You don’t have to make comments yourself to read my messages.

Russell 2000 U.S. Small Cap Chart (RUT, IWM; click the chart to enlarge it):  Small caps continue to outperform large caps.

rut-small-cap-russell-2000-index-market-timing-chart-2015-04-02-close

Small caps still stronger than the SP500 Index.

The Gold ETF Chart (GLD; click to enlarge the chart): (see above and below for predictions)  Gold seems to have found a floor for the time being at least.

gld-gold-etf-market-timing-chart-2015-04-02-close

Gold holding up on Central Bank easing worldwide.

Please Click the TNX Chart to enlarge it (see related ETFs, TLT, UBT and TBT): The 10 year yield did in fact fall back below 19.30 as predicted.

tnx-10-year-treasury-note-market-timing-chart-2015-04-02-close

Rates will head lower.

CONCLUSIONS:  The rise of TLT will likely continue Monday.  Yields were falling after the 8:30 am announcement of the employment numbers.  Stocks may struggle for a few days or weeks depending on how poor forward guidance is during the upcoming earnings season.  Gold could keep some momentum with falling rates AND a falling U.S. dollar.  The U.S. dollar’s course is harder to predict than rates over of the next few months for reasons discussed in detail in last week’s post.  That means gold’s course could surprise us as well as it generally will move opposite the U.S. dollar as long as worldwide panic is not occurring.

For now, we’ll stay with U.S. stocks through the near-term bumps and with long term U.S. Treasuries (TLT).  We hold a standard 5% in gold long term as insurance, but have no trading position on and won’t until the dollar’s course has clearly shifted to the downside.

I cover foreign markets on social media (see links above) and in my monthly newsletter.  Note that the newsletter is now closed again to new subscriptions: Join the Wait List to Join the Newsletter as a Loyal Subscriber, Opening again for the July. 5th issue.  If you join and don’t read the newsletter, you will be deleted.  I don’t publish to non-readers as other newsletters do.  Stay tuned here in the meantime and follow all the action via the Twitter® and StockTwits® links above.

Be sure to visit the website at: Sun and Storm Investing™

Standard Disclaimer: It’s your money and your decision as to how to invest it.

I thank Worden Brothers for the charting system I use to post these charts.  If you want to know more about the charting system I use every day, go to my “Other Resources” page here:  Other Resources   It makes it much easier to follow along with me if you can see the charts and manipulate them on your own computer.  It’s a great investment to have an excellent charting system.  Check it out with a free trial at the link above.

Copyright © 2015 By Wall Street Sun and Storm Report, LLC All rights reserved.

Posted in Bonds, gold, investment, large cap stocks, S&P 500 Index, small cap stocks, Treasuries | Tagged , , , , , , , , , , , , , , , , , | Leave a comment

Market Timing Brief for the 3-27-2015 Close: Lower U.S. Rates is the Best Bet Around (Updated 5-11-2015))

A Market Timing Report based on the 3-27-2015 Close, published Sunday March 29nd, 2015

I keep my comments reasonably brief to honor both my time and yours.  The rest is on Twitter®/StockTwits®.

UPDATE 5-1 1-2015: Just 9 days ago, the 10 year Treasury was at a yield of 1.977% and now it’s at 2.269%, which is a BIG move to happen that quickly.  A close above 2.259% is a trend changer, but sometimes there are “fake-outs” just above resistance, so be careful not to switch teams too dramatically at these breakout points.  IF this new breakout in yields sticks, my “Best Buy Idea” will have been shot!

Let’s see how I did with…

MY CONCLUSIONS FROM LAST WEEK

PREDICTION for U.S. stocks: “Next stop for the SPX [SP500 index]?  We will likely match the prior high, but I’m guessing we’ll get to a new high [meaning go even higher].  Earnings are due to fall this quarter, so there could be bumps along the way, but as long as the Fed is out of the way, rates are under control, and growth continues, albeit at a slower pace, stocks will do OK.”

We got the bump DOWN rather than a further rally.  My Bullish outlook was wrong short term.  On the positive side, we have a higher low to work with IF it holds up.  I say stay long and over the term of say, a few weeks, you’ll still be ahead.  Individual stocks could be another thing as those guiding down on future earnings will be hit badly.  Stick with indices unless you know your companies’ earnings are a lock.

If you have not yet read my market scenario for the next few months, it’s a must read here:

The Scenario That Will Unfold

Continuing with the recap of last week’s predictions…

PREDICTION: “Small caps suggest a bounce, while large caps are lagging, still below the prior breakout.”

Small caps remain ahead.  I predict that big and small stocks will now rally into earnings that begin with Alcoa (AA) on April 8th.  If some earnings and guidance comes in under expectations, market shocks will occur with some retracement of the indices.  A rally is not a given, but I would say you could add some SPY here if you are underexposed to large cap stocks.  Save some powder to add more lower if the markets tumble on earnings.  Due to the higher volatility with small caps, I would not buy those here unless you apply stops carefully.

PREDICTION: “Rates will head still lower.  That will keep gold from breaking support, but the U.S. dollar must keep falling from here to have gold rally in a much more substantial way. “

1. Rates? Wrong short term.  Rates DID initially break below 19.30 but then rallied above it.  I believe this week rates could break through that 19.30 level on the 10 Year Treasury Note (Treasuries will rally; higher TLT).

2. Gold?  My prediction is/was that gold will not be a big loser and could bob up and down depending on the forces for or against it.  In other words, I’m not a big fan of gold except as insurance at the moment.  The rally held up, but eased on Friday.  GDX is doing worse, and we were out near the top.  I say the dollar will rise this week, and gold will fall (GLD).

3. U.S. Dollar?  On that I was right.  It went down.  It now appears set up to rally after a correction.  Truthfully, all we know is that we are at a pivot point.  Trade the next move UP or down.  But I’ll go on record that I’m betting on DOLLAR UP for this week (UUP).

And now for the charts for the week:

SP500 Index (SPX, SPY; click the chart to enlarge it):

Note that we are both below the Dec. high and below the lower yellow channel line.  The latter is a BROKEN wedge that leads back to the October low, which is my outside Bearish scenario (see below).  We need to recover quickly above that lower yellow trend line on the daily chart.

sp500-index-market-timing-chart-2015-03-27-close-daily

SPX eases a bit.

To find out what I’m doing, including buys and sells, please follow me here: Follow Me on Twitter®.   Follow Me on StockTwits®   You don’t have to make comments yourself to read my messages.

My greater concern is over the intermediate term (weekly) chart:

Follow the pink line up from the October low in the chart above from 2011.  Note that the pink weekly trend line was violated to the downside in October.  There was a recovery above it into the end of 2014, but in 2015, we’ve never gotten above it (look 2 charts down for higher magnification of this).  Before that, we had gone about TWO years without violating that line, so things have changed.

sp500-index-market-timing-chart-2015-03-27-close-weekly

SP500 Index losing steam on weekly chart.

We are now back below the end of December 2014 high as shown in the chart below. 

sp500-index-market-timing-chart-2015-03-27-close-daily-2

SP500 Index lost momentum since 12-2014.

All of this means that we must rally quickly or we risk revisiting the December or Jan-Feb. lows.  If things get much sloppier during earnings season, we could hit the October low again, but I’m not betting on that.  If earnings are not that bad, we’ll stay above the Dec. low.

Russell 2000 U.S. Small Cap Chart (RUT, IWM; click the chart to enlarge it):

rut-small-cap-russell-2000-index-market-timing-chart-2015-03-27-close

Small caps still resilient vs. large based on greater exposure of large caps to dollar strength.

The Gold ETF Chart (GLD; click to enlarge the chart): (see above and below for predictions)

gld-gold-etf-market-timing-chart-2015-03-27-close

Gold rises, but the dollar must fall another notch to sustain the gold rally.

Please Click the TNX Chart to enlarge it (see related ETFs, TLT, UBT and TBT): 

tnx-10-year-treasury-note-market-timing-chart-2015-03-27-close

Rates should head lower now in the face of worldwide deflationary pressure.

CONCLUSIONS:  The U.S. stock market is tired.  Earnings warnings by Intel and other companies have slowed the rise of the SP500 Index a bit.  The Fed WILL raise rates to 0.5% by September at the latest they say, but long rates will head lower as described in detail in my prior post (see link above to “The Scenario That Will Unfold”).  A higher SP500 Index low has been formed as of this week, which allows for a rally, IF the Bulls want to retake the reigns.  I believe the U.S. markets will be higher for this year, but the short term is up for grabs.  As said, if earnings are not that bad, we’ll stay above the Dec. low.  Otherwise the October low comes into play.

I’ll go out on a limb to say that:

– stocks (SPY, SPX) will rise a bit this week off the higher low formed at the end of this past week along witha

– stronger U.S. dollar

– weaker gold

– falling interest rates (rallying Treasuries and bonds).

Of all of those predictions, I’d say that lower interest rates is the most likely for the week.  That means sticking with TLT (or UBT using 2X leverage) and municipal bonds.

I cover foreign markets on social media (see links above) and in my monthly newsletter.  Note that the newsletter is now closed again to new subscriptions: Join the Wait List to Join the Newsletter as a Loyal Subscriber, Opening again for the April. 4th issue.  If you join and don’t read the newsletter, you will be deleted.  I don’t publish to non-readers as other newsletters do.  Stay tuned here in the meantime and follow all the action via the Twitter® and StockTwits® links above.

Be sure to visit the website at: Sun and Storm Investing™

Standard Disclaimer: It’s your money and your decision as to how to invest it.

I thank Worden Brothers for the charting system I use to post these charts.  If you want to know more about the charting system I use every day, go to my “Other Resources” page here:  Other Resources   It makes it much easier to follow along with me if you can see the charts and manipulate them on your own computer.  It’s a great investment to have an excellent charting system.  Check it out with a free trial at the link above.

Copyright © 2015 By Wall Street Sun and Storm Report, LLC All rights reserved.

Posted in Bonds, gold, investment, large cap stocks, S&P 500 Index, small cap stocks, Treasuries | Tagged , , , , , , , , , , , , , | 2 Comments

Market Timing Brief for 3-26-2015: A Possible Scenario for the Fed, Rates (Bonds), Stocks, Gold, and the U.S. Dollar.

A Market Timing Report about Fed FOMC rate changes and how they may move the various markets…

Here’s my proposed scenario:

1. The Fed insists, as Fed Gov. Bullard repeated this morning, that it wants to move off “zero interest rates,” so we’ll start with that as a given, despite the probable foolishness of that short term due to the dollar strength it will create!  Maybe the Fed won’t raise rates in the end, but the scenario below still applies except that the differences would be that short rates won’t be going up as much obviously (the Fed more or less directly controls those via the Fed Funds rate) and long rates might not go down as much either.

2. Short rates rise, pushing LONG RATES DOWN.  That has happened before and it will happen again if the Fed moves now.  Why?  There is deflation at the moment, so raising rates into deflation makes no sense.  Raising short rates can pressure long rates down, because future expectations for inflation are lowered by raising interest rates in the face of deflation or very low levels of inflation.

3. The U.S. Dollar (UUP, EURUSD)?  The Fed will be behind the other central banks around the world regardless, unless QE 4 appears as @KeithMcCullough said recently.

The dollar will go up on both:

A) higher short rates which will draw cash from the rest of the world seeking a short term haven above zero interest rates (or negative interest rates as in Germany) and…

B) as mentioned, the lack of a U.S. QE program, which keeps the U.S. behind the rest of the world on currency destruction.

4. Stocks (SPX, SPY, RUT, IWM)?  U.S. Stocks rise as they’ve done repeatedly before on slowly rising rates.  I went over that here: Rates Rise, Stocks Rally.  This will happen as long as recession stays out of the picture and even slow growth continues in U.S. GDP.  Stocks will weaken at times the economy/GDP appears to be decelerating of course.  So we buy some more at the lows and sell some at the highs.

5. Gold (GLD)?  With the dollar up and inflation still under control in the U.S., gold is pressured (after current rally is over and dollar resumes its climb).  Easing by rest of world keeps it in demand though, so gold is sideways to down somewhat, after the current rally ends.  Careful though: Gold will reach new lows on worldwide recovery IF that happens. 

6. Treasuries and Bonds?  Long rates will be lower as said, so U.S. Treasuries (TLT, UBT) and other bonds rally.

And all this changes if there is a new QE program in the U.S.  Remember that the picture we are seeing is constantly changing, so we need to be willing to change our view accordingly.

**Fund Funds Rate Reference

NOTE: I cover foreign markets on social media (see links above) and in my monthly newsletter.  The newsletter is now closed again to new subscriptions: Join the Wait List to Join the Newsletter as a Loyal Subscriber, Opening again for the April. 4th issue.  If you join and don’t read the newsletter, you will be deleted.  I don’t publish to non-readers as other newsletters do.  Stay tuned here in the meantime and follow all the action via the Twitter® and StockTwits® links above.

Be sure to visit the website at: Sun and Storm Investing™

Standard Disclaimer: It’s your money and your decision as to how to invest it.

I thank Worden Brothers for the charting system I use to post these charts.  If you want to know more about the charting system I use every day, go to my “Other Resources” page here:  Other Resources   It makes it much easier to follow along with me if you can see the charts and manipulate them on your own computer.  It’s a great investment to have an excellent charting system.  Check it out with a free trial at the link above.

Copyright © 2015 By Wall Street Sun and Storm Report, LLC All rights reserved.

Posted in Bonds, gold, investment, large cap stocks, S&P 500 Index, small cap stocks, Treasuries | Tagged , , , , , , | Leave a comment

Market Timing Brief for the 3-20-2015 Close: Stocks Will Go Higher In Time. Gold Has A Shot. Rates Will Fall Further.

A Market Timing Report based on the 3-20-2015 Close, published Sunday March 22nd, 2015

I keep my comments reasonably brief to honor both my time and yours.  The rest is on Twitter®/StockTwits®.

Let’s see how I did with:

CONCLUSIONS FROM LAST WEEK

U.S. stocks may be at a pivot point, where a bounce will occur. 

Right.

Small caps suggest a bounce, while large caps are lagging, still below the prior breakout. 

Right.  Small caps led the bounce too.

Follow interest rates, and you’ll know where stocks will go, because you’ll know where the U.S. dollar is going.

Right. The dollar jerked around but has fallen from the last high. 

Gold must hold support, or we’ll have another free fall.

Gold did hold. Free fall avoided for now.

I should claim victory, as we were overexposed to the stock markets of the world prior to the most recent rally back.  The thing is, the direction of the market changes often, so there is an opportunity to be right and wrong within any extended period of time.  What HAS been right is STAYING IN THE STOCK MARKET and U.S. TREASURIES.

(If you have not yet read what will happen IF the Fed raises rates, you’ve just got to read this: It’s Not What You Think)

Most individual investors are incapable of sitting still and letting stocks do their thing.  They jerk their money in and out, often at the exact wrong times.  If you have been doing this for most of your life, there is still hope.  NOW STOP IT!  Did you hear that?  STOP SCREWING UP YOUR INVESTMENT RESULTS BY OVERTRADING!  Post that on your office wall, and you’ll make a fortune investing from here on.

There is no recession in view and the Fed this week did what I thought they would.  They removed the word patient and then said they’d have to be patient!   The exact wording did not matter.  They simply needed the market do know that they were not on some stupid Fed autopilot that said they HAVE to raise rates in June.  They re-calculated their incorrect projections for our economy and lowered them.   I’ll show you the charts now.

SP500 Index (SPX, SPY; click the chart to enlarge it):

SP500 Index moves higher

Stocks continue their rally.

Next stop for the SPX?  The orange, majenta, or yellow trend lines shown in the above chart.  We will likely match the prior high, but I’m guessing we’ll get to a new high.  Earnings are due to fall this quarter, so there could be bumps along the way, but as long as the Fed is out of the way, rates are under control, and growth continues, albeit at a slower pace, stocks will do OK.

To find out what I’m doing, including buys and sells, please follow me here: Follow Me on Twitter®.   Follow Me on StockTwits®   You don’t have to make comments yourself to read my messages.

Small caps are stronger once again.  Valuations are now worse that a year ago according to L. Birinyi and the Wall St. Journal: Small Cap Valuations Too High Once Again

You can buy small caps despite higher valuations and stay with them for a while, but they will fall harder during pullbacks.  Buy low, sell high.  I’m using a different strategy, however, which is to leverage my large cap exposure.  I am not using margin, just deploying more cash than usual.  This may NOT be appropriate for you depending on your situation.

Russell 2000 U.S. Small Cap Chart (RUT, IWM; click the chart to enlarge it):

Small Caps Rule

Small caps run ahead of the SP500 Index.

Gold: GLD survived support at 109.67.  Gold still has the headwind of the U.S. dollar, which has been whipping around since the Fed statement and pony show.  But now rates are moving lower again, so the dollar may pull back as well.

What’s the cleaner bet that may be better than gold here?  Investing in Treasuries as shown in the 2nd chart below.

The Gold ETF Chart (GLD; click to enlarge the chart):

Gold faces dollar strength still.

Gold survived support for now.

The U.S. 10 Year Treasury Note: Keep buying every rise in rates (fall in Treasuries/TLT).  The only thing we can be certain of is that the 10 Year Treasury is going to keep falling to catch up to the rest of the world.  Either that or the Fed kills the U.S. economy. Now what do you really think they will do???  Buy TLT on every pullback until this changes (inflation rears its head).

Please Click the TNX Chart to enlarge it (see related ETFs, TLT, UBT and TBT; NOTE THIS IS A WEEKLY Chart): 

Rates will fall more.

Rates will move lower. It is all but guaranteed.

CONCLUSIONS:  The SP500 will move still higher.  The Fed will ensure that by keep interest rates low for a long time. 

Our rates are still higher than the rest of the developed world.  They must head lower.  It has nothing to do with that being “good” or “right.”  It has to do with what is going to happen.  Rates will head still lower.  That will keep gold from breaking support, but the U.S. dollar must keep falling from here to have gold rally in a much more substantial way. 

Some think the U.S. is not willing to join Europe in easing with a U.S. QE 4, so the dollar will stay relatively strong, even if the Fed does not RAISE rates.  That, if true, is a headwind for gold, which needs negative real rates (meaning inflation exceeding interest rates on Treasuries) and a stable to falling dollar to flourish.

My prediction in the short term is different from that.  I say in the next week, rates will break the support shown in the above chart (below prior low), the dollar will trade lower, and gold (and the SP500) will move higher.  We’ll check back next week to see if that was right.

In the meantime, due what is a GIVEN almost over the intermediate term, LOWER U.S. RATES will cause Treasuries to rally from here (think TLT).  This interest rate bet is even better than the bet on U.S. stocks, because soft Q1 earnings could cause stocks to thrash around in a few weeks.

Remember that if you did not buy when we bought, this is not the ideal time to buy.  Your risk is higher now.  If you must, buy some here and wait for the next pullback in stocks and Treasuries to buy more.

I cover foreign markets on social media (see links above) and in my monthly newsletter.  Note that the newsletter is now closed again to new subscriptions: Join the Wait List to Join the Newsletter as a Loyal Subscriber, Opening again for the April. 4th issue.  If you join and don’t read the newsletter, you will be deleted.  I don’t publish to non-readers as other newsletters do.  Stay tuned here in the meantime and follow all the action via the Twitter® and StockTwits® links above.

Be sure to visit the website at: Sun and Storm Investing™

Standard Disclaimer: It’s your money and your decision as to how to invest it.

I thank Worden Brothers for the charting system I use to post these charts.  If you want to know more about the charting system I use every day, go to my “Other Resources” page here:  Other Resources   It makes it much easier to follow along with me if you can see the charts and manipulate them on your own computer.  It’s a great investment to have an excellent charting system.  Check it out with a free trial at the link above.

Copyright © 2015 By Wall Street Sun and Storm Report, LLC All rights reserved.

Posted in Bonds, gold, investment, large cap stocks, S&P 500 Index, small cap stocks, Treasuries | Tagged , , , , , , , , , , , , , | 2 Comments

Market Timing Brief for 3-18-2015: What Actually Happened to Stocks When Fed Interest Rates Rose in the Past?

A Market Timing Report about Fed FOMC rate changes and how they have effected the U.S. Stock Market (SPX, SPY) historically…

Fed Funds Rates: Rapidly Falling Rates Are Negative for the U.S. Stock Market (SP500).  Rising Rates Are Mostly Bullish for Stocks.

12-1992 = low of 2.92%

Rates rose and stocks rose strongly.  The low was followed by minor SP500 Index downside and some volatility then a strong rally.

4-1995 = high of 6.05%

No significant SP500 Index downside, then strong rally, but situation was not at an extreme.  This was proven by the fact that rates did not drop much for the next few years. Next low was fairly high, at 4.63% in 1-1999.  In addition, stocks were not that expensive in 1995 vs. 2000.

1-1999 = low of 4.63%

Rates rose and stocks rose strongly.  No significant SP500 Index downside, then strong rally through 1999, the biggest bubble ever in our markets.

7-2000 = high of 6.54%

Rates were lowered quickly and stocks crashed.  SP500 Index sold off hard after that from the July 2000 lower highs in both NASDAQ and SPX. 

12-2003 = low of 0.98%

Rates rose and stocks rose strongly.  Market had rallied strongly in 2003, then after the 12-2003 low in rates rallied further, gave up the gains, and then rallied up until 2007.

2-2007 = high of 4.26%

Rates were lowered quickly and stocks crashed.  Market sold off, then rallied to new high, gave up all gains, then hit a marginal new high and sold off massively from 10-11-2007 top of 1576.09 to 666 on March 6, 2009 intraday.

2015?  

Is it different this time, or should we expect rising rates to be GOOD for the market? What are the implications for share buybacks with rising rates? How much will growth of earnings per share fall if rates rise X%?

CONCLUSIONS: Unless it is truly different this time, due to distortions of ultra-low rates and the massive Fed balance sheet, it won’t be different this time in the stock market!  I challenge my colleagues to do the calculation of the impact on earnings growth when stock buybacks become more expensive, or come up with other feasible reasons that it is in fact different this time.  Stanley Druckenmiller has said he does not know if the Fed can get out of its balance sheet without causing trouble OR NOT.  Not knowing is being more honest than saying you know, but for no good reason!

History says that gradually rising rates have not been bad for the market for the past few decades.  The backdrop today is very unusual though, as U.S. dollar strength will only get worse if the Fed raises rates while the rest of the world is lowering rates. 

My opinion?  Though I am no fan of low rates, given the Fed’s goals, keeping them steady until a low level of inflation (their 2% goal) returns might be more prudent than raising rates simply to get them “off zero.”

**Fund Funds Rate Reference

NOTE: I cover foreign markets on social media (see links above) and in my monthly newsletter.  The newsletter is now closed again to new subscriptions: Join the Wait List to Join the Newsletter as a Loyal Subscriber, Opening again for the April. 4th issue.  If you join and don’t read the newsletter, you will be deleted.  I don’t publish to non-readers as other newsletters do.  Stay tuned here in the meantime and follow all the action via the Twitter® and StockTwits® links above.

Be sure to visit the website at: Sun and Storm Investing™

Standard Disclaimer: It’s your money and your decision as to how to invest it.

I thank Worden Brothers for the charting system I use to post these charts.  If you want to know more about the charting system I use every day, go to my “Other Resources” page here:  Other Resources   It makes it much easier to follow along with me if you can see the charts and manipulate them on your own computer.  It’s a great investment to have an excellent charting system.  Check it out with a free trial at the link above.

Copyright © 2015 By Wall Street Sun and Storm Report, LLC All rights reserved.

Posted in Bonds, gold, investment, large cap stocks, S&P 500 Index, small cap stocks, Treasuries | Tagged , , , , , , | Leave a comment

Market Timing Brief for the 3-13-2015 Close: Rates Are In Charge of the U.S. Dollar, Stocks and Gold. Rate Rise Over Yet?

A Market Timing Report based on the 3-13-2015 Close, published Sunday March 15th, 2015

UPDATE 3-17-2015: And the Winner Is?  Small Cap Growth as shown:

rut-small-caps-growth-vs-value-market-timing-chart-2015-03-17-1211pm

Small Cap Growth Is Beating Small Cap Value and the SP500 Index.

And now back to this week’s issue: I keep my comments reasonably brief to honor both my time and yours.  The rest is on Twitter®/StockTwits®.

The recent stock market selling, in my view, is due to rates going up in fear of the Fed raising interest rates into worldwide deflation (although maybe the rise ended last week).  Perhaps Jim Cramer should pull out and replay his “They know nothing!” tirade about the Fed during the 2008 crisis.  Of course, what the Fed SHOULD do and what the Fed WILL do are two different things.

My belief is that the Federal Reserve has introduced great distortions into the monetary system by making it easy for companies like IBM to borrow money at dirt cheap rates and then buy back their stock to raise their earnings per share without innovating and thereby strongly growing revenue.  It is a Fed driven scam really (I’m sure there are many noble people at IBM who mean well), and it’s unproven that it will work or not work in the end as Stanley Druckenmiller has pointed out.  He thinks the tricks won’t work at IBM as he had publicized his short repeatedly.  But he also said on CNBC that he really did not know whether the Fed could get out of its balance sheet safely or not.

Those that tell you the Fed balance sheet will result in hyperinflation are likely as lacking in true insight as those who think the Fed can expand its balance sheet without limit.  The only thing we know is that the longer they take to unwind it, the less flexibility they will have to do anything the next time action is actually needed.   That is why the Fed is going to raise interest rates a bit even though there is worldwide deflation in the midst of now worldwide easing outside the U.S. and the U.K.  Meanwhile, the Eurozone, Japan and China are all easing.

But there is downside to this tactic in U.S. corporate multinational earnings, because with every move UP in U.S. rates, up goes the U.S. dollar and down goes the competitiveness of U.S. multinationals in the short to intermediate term.   I believe this is the most important reason stocks could struggle for a while.

Investors need to hold NON-struggling companies in the near term.  That is why small caps are being favored in this pullback as they have less U.S. dollar exposure.  They have bounced more than large caps as shown below (despite their higher valuations – if an individual small cap’s growth matches its valuation, it’s not an issue).  Near term, profits for the SP500 Index are supposed to decline a bit in the first quarter.  This is happening to an extent due to U.S. dollar strength.  This will pressure U.S. multinational stock prices until other foreign currencies stabilize vs. the U.S. dollar.  If the U.S. dollar keeps moving higher, expect the SP500 Index to move lower.

SP500 Index (SPX, SPY; click the chart to enlarge it):

sp500-index-market-timing-chart-2015-03-13-close

Pivot point. Up or down from here?

To find out what I’m doing, including buys and sells, please follow me here: Follow Me on Twitter®.   Follow Me on StockTwits®   You don’t have to make comments yourself to read my messages.

Small caps are stronger, as mentioned above.  Stick with the high growers!  Stock pickers will be looking for growth in a slowing economy this year.  Small caps REGAINED their prior breakout, while the SP500 Index has not.  Compare the chart below with the SP500 chart above.

Russell 2000 U.S. Small Cap Chart (RUT, IWM; click the chart to enlarge it):

rut-small-cap-russell-2000-index-market-timing-chart-2015-03-13-close

Small caps are holding up better than large caps.

Gold has now basically destroyed its prior rally.  Last GLD support is at 109.67 as mentioned last week.  Watch interest rates and the U.S. dollar.  

Gold should hold the prior low IF:

1. Rates stopped going up as of last week.

2. The U.S. dollar starts to ease. 

Only in a financial panic can gold and the U.S. dollar rise together.  We don’t have such a panic at the moment.

The Gold ETF Chart (GLD; click to enlarge the chart):

gld-gold-etf-market-timing-chart-2015-03-13-close

Gold nears last support.

The U.S. 10 Year Treasury Note:

Please Click the TNX Chart to enlarge it (see related ETFs, TLT, UBT and TBT; NOTE THIS IS A WEEKLY Chart): Rates hit the 200 day moving average and moved down this past week.  A new high in rates may cause gold to fail its support.  The stock market fear of the Fed is due to fear of U.S. dollar strength in the absence of strong economic growth.

tnx-10-year-treasury-note-market-timing-chart-2015-03-13-close

Have rates stopped rising?

CONCLUSIONS: U.S. stocks may be at a pivot point, where a bounce will occur.  Small caps suggest a bounce, while large caps are lagging, still below the prior breakout.  Follow interest rates, and you’ll know where stocks will go, because you’ll know where the U.S. dollar is going.

Gold must hold support or we’ll have another free fall.

Rates are driving the above almost single-handedly.  Follow rates and you know what gold and stocks will do near term.  When growth picks back up, this will change and we should expect gradually rising rates.

I cover foreign markets on social media (see links above) and in my monthly newsletter.  Note that the newsletter is now closed again to new subscriptions: Join the Wait List to Join the Newsletter as a Loyal Subscriber, Opening again for the April. 4th issue.  If you join and don’t read the newsletter, you will be deleted.  I don’t publish to non-readers as other newsletters do.  Stay tuned here in the meantime and follow all the action via the Twitter® and StockTwits® links above.

Be sure to visit the website at: Sun and Storm Investing™

Standard Disclaimer: It’s your money and your decision as to how to invest it.

I thank Worden Brothers for the charting system I use to post these charts.  If you want to know more about the charting system I use every day, go to my “Other Resources” page here:  Other Resources   It makes it much easier to follow along with me if you can see the charts and manipulate them on your own computer.  It’s a great investment to have an excellent charting system.  Check it out with a free trial at the link above.

Copyright © 2015 By Wall Street Sun and Storm Report, LLC All rights reserved.

Posted in Bonds, gold, investment, large cap stocks, S&P 500 Index, small cap stocks, Treasuries | Tagged , , , , , , , , , , , , , | Leave a comment

Market Timing Brief for the 3-06-2015 Close: SP500 Index Breakout Reversed. The Gold Trade Fails. Rates Rising On Fed Fears.

A Market Timing Report based on the 3-06-2015 Close, published Sunday March 8th, 2015

I keep my comments brief to honor both my time and yours.  The rest is on Twitter®/StockTwits®.

Here is the lay of the land for the LONG TERM World Economic Picture:

1. The world economy is slowing outside of the U.S.

2. The entire world other than the U.S. and the U.K. is planning more easing of monetary policy.

3. There is a fear that arose last week that the economic data in the U.S. is too strong, which will force the Fed to raise rates, perhaps more than “one and done.”  If that happens, it provides competition for stocks for investors who want a safer return at higher rates than are available today.  This would bring down stock and bond prices. That’s why they fell last week, but see the next section to understand why they are likely to rise again before they fall too far (does not preclude up to 10% corrections).

4. The slowdown abroad will keep the U.S. economy from expanding too rapidly and corporate profits are already lower due to dollar strength.

5. The Fed will raise rates marginally over 1-2 meetings and be done at about 0.5% off zero after one to two meetings due to the weakness of the world economy.

6. Eventually all the fuel added to the fire WILL work and there will be too much inflation despite the slow growth of the world economy.

7. Central banks will have to tighten to prevent prices from rising rapidly.  The Fed’s mandate includes both employment and inflation, and it will be forced to act at a certain point.

8. Government fiscal policy will have to change because the Fed and other Central Banks will be powerless to stimulate the economy due to inflation.  All they will be able to do is to fight the inflation they will eventually create.

9. The stock market will be in a slump for 5 years or more if nothing is done on the fiscal side or if innovation stalls over the next few years.  Relying on Congress to get something done has not been a reliable investment thesis!

The SHORT TERM Picture is Much Different (remember that this is an HYPOTHESIS):

1. Rates will stay low for a while around the world including in the U.S. due to pressure of other foreign banks with zero to sub-zero rates.

2. This will fuel equity prices further.  The rally will continue for a year or two here and abroad.  The current correction should be no more than 10% and could be shallow in the U.S., as the U.S. economy is still growing.  If Europe does not respond to ECB QE, those markets will suffer, but the expectation is that this will work as it did in the U.S.   If you buy that, buy Europe.  I’ve bought the U.K., because it should benefit from the ECB easing while not suffering a currency decline to the extent that the Euro has and will continue to sustain.  HEDJ has worked well lately, but if the Fed is forced to stand aside, the dollar could take a hit.  It might be smartest to be currency neutral by buying both a U.S. dollar hedged and a non-USD hedged Eurozone ETF.

3. Gold will maintain its value, but stays range bound for several years until inflation picks up again or the U.S. dollar is damaged by further Fed policy interventions such as QE.  If gold breaks to new lows, I’d consider stepping aside until a bottom is formed again.  If it holds the recent range, I’d keep some gold on board for a hedge against inflation.

How about the very immediate term?  The SPX has failed its prior breakout.  I mentioned last week that we’d have to fall below the prior breakout at 2093.55 to void it.  We did.  Some were buying on Friday.  They may be right for a day or two, but there is plenty of room for this pullback to continue.  For example, we could bounce from around the 50 day moving average and then fail again.

SP500 Index (SPX, SPY; click the chart to enlarge it):

sp500-index-market-timing-chart-2015-03-06-close

Breakout has failed. Will we recover it quickly or is this going to be a significant correction?

To find out what I’m doing, including buys and sells, please follow me here: Follow Me on Twitter®.   Follow Me on StockTwits®   You don’t have to make comments yourself to read my messages.

Small caps have failed their breakout as well.  I mentioned last week that the valuation of the RUT is stretched almost to where it was a year ago (per Wall Street Journal stats).  We need to fall further to bring valuations down to a more reasonable level perhaps, especially if the Fed raises rates too much.

Russell 2000 U.S. Small Cap Chart (RUT, IWM; click the chart to enlarge it):

rut-small-cap-russell-2000-index-market-timing-chart-2015-03-06-close

Another failed breakout.

Gold has all but destroyed its rally.  There is one more level of support below this at 109.67 and then an opportunity to go into free fall.  It would seem with all the easing going on around the world, that this should not happen.  It would seem that gold would be a good deal still under those circumstances.  Sometimes the market has a different idea about what is happening than what the theory says.  Use stops on your positions.

The Gold ETF Chart (GLD; click to enlarge the chart):

gld-gold-etf-market-timing-chart-2015-03-06-close

Gold must hold the prior base or we’ll have another free fall.

Please Click the TNX Chart to enlarge it (see related ETFs, TLT, TBT and UBT): Rates rose despite the downward pressure from abroad.  It seems that the rise is unsustainable given that, but the TNX will have to reverse soon to prove it.  Perhaps it will happen at the 200 day moving average or the yellow resistance line shown.

tnx-10-year-treasury-note-market-timing-chart-2015-03-06-close

Rates rising again on Fed fear.

CONCLUSIONS: The U.S. stock market breakouts were both lost.  Even if we get a bounce here, there is a danger that the market has reset to the notion that the Fed is raising rates and that it will do so too aggressively.  I don’t believe it can raise rates significantly, so I expect the equity markets to continue to do well in the short term despite 3% dips and 10% corrections this year.  Buy the lows and sell some at the highs. 

The gold entry from last week was a bust, but there is one last level of support, before another free fall begins.   Make you nervous?  That is the nature of markets and at times, they fall just below support to scare out the most weak hands before rising strongly.

From last week, and this is still true in my opinion: “The recent Federal Reserve speeches are all aligned with a more dovish Fed policy despite their threat of moving the Fed Funds rate off zero.”  That means rates will go lower again.  From what level they fall is the issue we face in the near term.  No one can answer that unfortunately. 

I cover foreign markets on social media (see links above) and in my montly newsletter.  Note that the newsletter is now closed again to new subscriptions: Join the Wait List to Join the Newsletter as a Loyal Subscriber, Opening again for the April. 4th issue.  If you join and don’t read the newsletter, you will be deleted.  I don’t publish to non-readers as other newsletters do.  Stay tuned here in the meantime and follow all the action via the Twitter® and StockTwits® links above.

Be sure to visit the website at: Sun and Storm Investing™

Standard Disclaimer: It’s your money and your decision as to how to invest it.

I thank Worden Brothers for the charting system I use to post these charts.  If you want to know more about the charting system I use every day, go to my “Other Resources” page here:  Other Resources   It makes it much easier to follow along with me if you can see the charts and manipulate them on your own computer.  It’s a great investment to have an excellent charting system.  Check it out with a free trial at the link above.

Copyright © 2015 By Wall Street Sun and Storm Report, LLC All rights reserved.

Posted in Bonds, gold, investment, large cap stocks, S&P 500 Index, small cap stocks, Treasuries | Tagged , , , , , , , , , , , , , | Leave a comment