Market Timing Brief for the 7-18-2014 Close: Stocks Testing Lower High. Gold Faltering.

A Market Timing Report based on the 7-18-2014 Close, published Sunday July 20, 2014

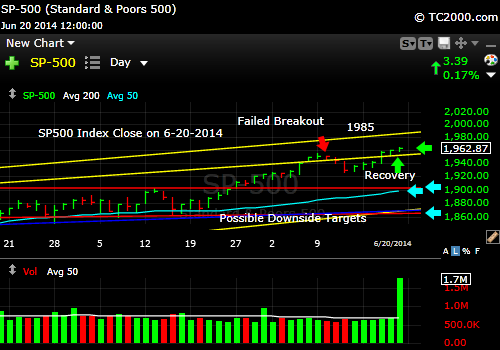
The SP500 Index was repelled from the upper yellow channel line and is currently above the lower channel line shown.  The Bulls have a shot to achieve more gains, but must now push the index to a brand new high in the midst of wars in the Ukraine and the Middle East and earnings both good and not so good and a housing slow down that is now well documented.

Here’s the SP500 Index Chart (click to enlarge):

sp500-index-market-timing-chart-2014-07-18-close

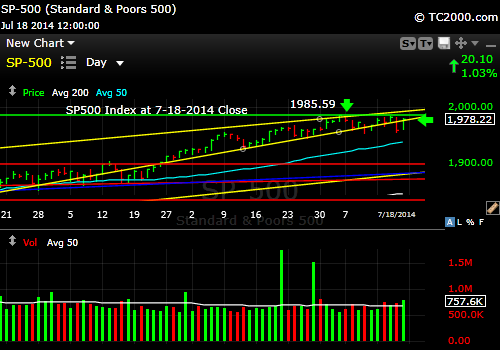
SP500 Index forming a lower high. A new high is needed by the Bulls.

To get my weekly report with my current market allocations subscribe here for free: Free Subscription to My Newsletter and access to My Latest Comments/Strategy.

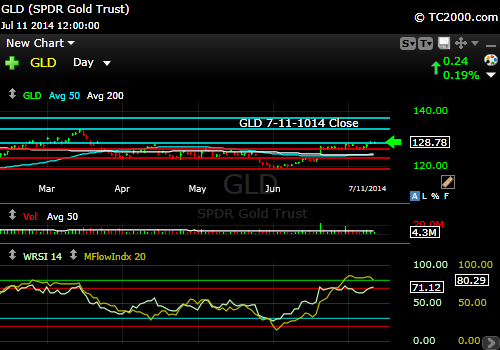
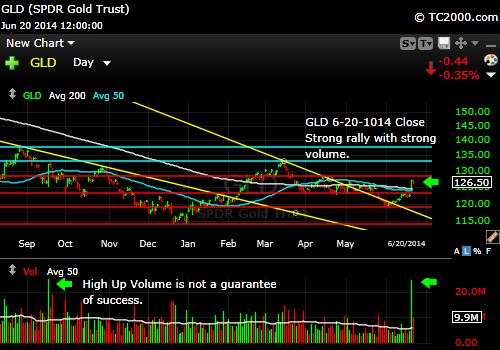
Gold (GLD) attempted a breakout the other day and failed and is still below the prior breakdown point.  As tweeted earlier this week, I believe that the weakness in the face of the Ukrainian plane downing is negative for the near term.  We still hold our long term GLD exposure, but have no trading position currently (to access all of our market allocations, please click the link above).

The Gold ETF Chart (GLD; click to enlarge the chart):

gld-gold-etf-market-timing-chart-2014-07-18-close

GLD is still below the prior breakdown point.

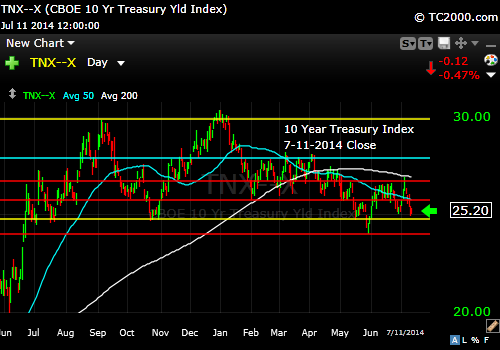
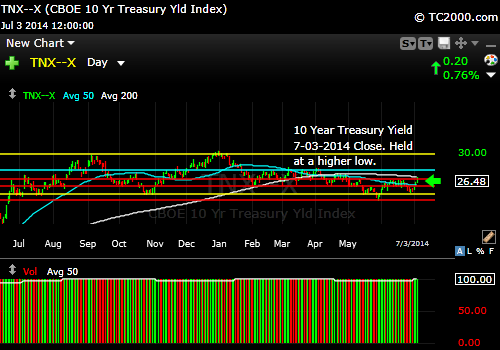
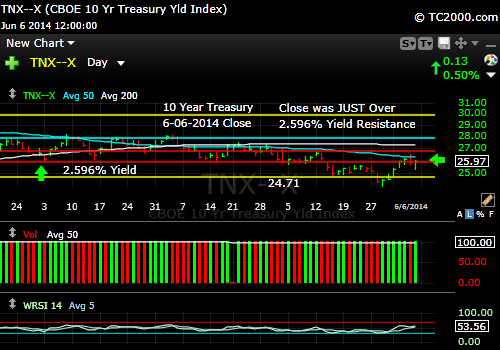
The 10 Year Treasury interest rate (TNX, tracked by TLT if Bullish; TBT if Bearish) would seem to be low enough for the Federal Reserve to be happy.  The fact that they simply keep pushing them lower is absurd and irresponsible.  As Stanely Druckenmiller pointed out last week at the CNBC conference, the Fed’s actions could turn out to be benign,, but since there is a risk of unintended consequences, there is reason to suspect more harm than good may come from continuing to support the current artificially low interest rates.

Here’s the chart (click to enlarge):

tnx-10-year-treasury-note-market-timing-chart-2014-07-18-close

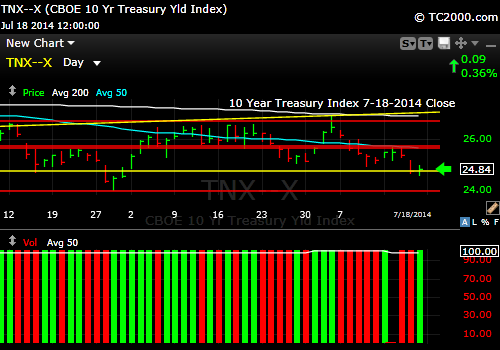
10 Year Treasury on support. Can rates go still lower?

CONCLUSION: Stocks have some work to prove themselves having recently failed at the upper channel line, but the trend for now is UP.  The gold rally faces the possibility of rising rates which will drive a U.S. dollar rally thereby pressuring gold.

Don’t miss out on my comments on Twitter® or StockTwits® where my buys and sells are posted.  You can read my Tweets whether you have a Twitter account or not: Follow Me on Twitter®.   Follow Me on StockTwits®.

Standard Disclaimer: It’s your money and your decision as to how to invest it.

I thank Worden Brothers for the charting system I use to post these charts.  If you want to know more about the charting system I use every day, go to my “Other Resources” page here:  Other Resources   It makes it much easier to follow along with me if you can see the charts and manipulate them on your own computer.  It’s a great investment to have an excellent charting system.  Check it out with a free trial at the link above.

Copyright © 2014 By Wall Street Sun and Storm Report, LLC All rights reserved.

Posted in Bonds, gold, investment, large cap stocks, S&P 500 Index, Treasuries | Tagged , , , , , , , , , , | Leave a comment

Market Timing Brief for the 7-11-2014 Close: Will Stocks Hold the Trend Line? Will Gold Just Keep Moving Up?

A Market Timing Report based on the 7-11-2014 Close, published Saturday July 12, 2014

The SP500 Index pulled back below the prior breakout above 1968.17, but it has held above the daily trend line shown the chart below.  A higher low has been created.  The question is whether the pullback is complete.  You can also see that the pullbacks to the yellow up trend line each brought the same degree of retreat in the RSI index (Relative Strength Index).  This indicates that the pullback may have been “sufficient.”  But maybe not as we must look to see if this rally is a broad one that also extends to the small caps.

Here’s the SP500 Index Chart (click to enlarge):

sp500-index-market-timing-chart-2014-07-11-close

SP500 Index is holding its daily trend line

If you look at the small caps, the picture is not as strong, and it appears that there could be another big leg down.  See how the RSI index has not completed it’s move to the prior lows?

rut-small-cap-russell-2000-index-market-timing-chart-2014-07-11-close

The Small Caps look like they have room to fall still.

To get my weekly report with my current market allocations subscribe here for free: Free Subscription to My Newsletter and access to My Latest Comments/Strategy.

Gold (GLD) has been making new highs as stocks have pulled back.  This is a positive sign.  The RSI appears to have topped out, but note that the Money Flow Index (yellow line in bottom part of the chart) has not and is making a new high.   This could allow gold to keep moving higher.

The Gold ETF Chart (GLD; click to enlarge the chart):

gld-gold-etf-market-timing-chart-2014-07-11-close

GLD has remained strong as stocks have weakened.

Remember that gold often does NOT hold up if the stock market sells off hard.  Investors start raising cash wherever they can find it.  I don’t expect that sort of stock market sell off at this point.

The 10 Year Treasury Interest rate (TNX, tracked by TLT if Bullish; TBT if Bearish) has been falling this week within the channel it’s been in , despite the strengthening belief that the Fed will raise rates in 2015.  Even in the face of QE, the Fed continues to have the benefit of low rates, which is helpful to gold.  The weak US Dollar is a great help to gold as well.

Here’s the chart (click to enlarge):

tnx-10-year-treasury-note-market-timing-chart-2014-07-11-close

10 Year Treasury Index still tame. The Fed is winning the bond war still.

CONCLUSION: Stocks could fall further, especially the small caps.  Gold probably has another leg up to go (subscribe to the newsletter via the above link to find out what % we have in our gold trade now).

Don’t miss out on my comments on Twitter® or StockTwits® where my buys and sells are posted.  You can read my Tweets whether you have a Twitter account or not: Follow Me on Twitter®.   Follow Me on StockTwits®.

Standard Disclaimer: It’s your money and your decision as to how to invest it.

I thank Worden Brothers for the chart system I use to post these charts.  If you want to know more about the charting system I use every day, go to my “Other Resources” page here:  Other Resources   It makes it much easier to follow along with me if you can see the charts and manipulate them on your own computer, so it’s a great investment to have an excellent charting system.

Copyright © 2014 By Wall Street Sun and Storm Report, LLC All rights reserved.

Posted in Bonds, gold, investment, large cap stocks, S&P 500 Index, Treasuries | Tagged , , , , , , , , , , | Leave a comment

Market Timing Brief for the SP500 Index, Gold and Treasury Yield Closes on 7-03-2014: Fed Chair Says Stocks Not In a Bubble. Meanwhile, Stocks Stretched, Gold On Pause and Rates Rising Again.

A Market Timing Report based on the 7-03-2014 Close, published Sunday July 6, 2014

The SP500 Index has hit and, although it’s difficult to see, it has slightly exceeded its upper channel.  The last bump up occurred after Federal Reserve Chair Janet Yellen said she did not believe stocks were in a bubble.  Although investors may continue to bid shares higher, earnings reports for Q2 are about to begin and could provide the impetus for lower stock prices.  One can argue that adding to your U.S. stock positions here may not prove to be the best entry point.  What could change this?  If earnings are strong and forecasts are also strong in the upcoming earnings reports, stocks could grind higher.  Employment is improving, and although the quality of jobs is somewhat limited, this does help consumer spending to improve and may provide enough growth to allow the market to at least go sideways for a while.

To get my weekly report (this week it’s a monthly addition along with all of my market allocations by percentage), subscribe here for free: Free Subscription to My Newsletter and access to My Latest Comments/Strategy.

Here’s the SP500 Index Chart (click to enlarge):

sp500-index-market-timing-chart-2014-07-03-close

SP500 Index stretched above channel line.

Gold (GLD) is holding up well, but could still correct.  The last small breakout was lost this past week, but the pullback has been minimal thus far.  We are still in our trading GLD position of the size given on the “WSSSR™ Access” page  (see link above).

The Gold ETF Chart (GLD; click to enlarge the chart):

gld-gold-etf-market-timing-chart-2014-07-03-close

Gold is holding up fairly well, but has lost some momentum.

The 10 Year Treasury Interest rate (TNX, tracked by TLT if Bullish; TBT if Bearish) is rising at the moment within the channel it’s been in The Fed has every intention of keeping it there for the foreseeable future, but eventually the bond market will lead the Fed.  It always has eventually done so, and it will this time.

Here’s the chart (click to enlarge):

tnx-10-year-treasury-note-market-timing-chart-2014-07-03-close

10 Year Treasury Yield is rising again.

CONCLUSION:  Stocks are stretched and overdue for a correction.  The gold trend is still up, and it’s early in the move.  Still, GLD could correct back to the top red line and still maintain an up trend.  Why should it pull back?  Because rates are rising and the dollar is strengthening, which is a headwind for gold.

Don’t miss out on my comments on Twitter® or StockTwits® where my buys and sells are posted.  You can read my Tweets whether you have a Twitter account or not: Follow Me on Twitter®.   Follow Me on StockTwits®.

Standard Disclaimer: It’s your money and your decision as to how to invest it.

I thank Worden Brothers for the chart system I use to post these charts.  If you want to know more about the charting system I use every day, go to my “Other Resources” page here:  Other Resources   It makes it much easier to follow along with me if you can see the charts and manipulate them on your own computer, so it’s a great investment to have an excellent charting system.

Copyright © 2014 By Wall Street Sun and Storm Report, LLC All rights reserved.

Posted in Bonds, gold, investment, large cap stocks, S&P 500 Index, Treasuries | Tagged , , , , , , , , , , | Leave a comment

Market Timing Brief for the SP500 Index, Gold and Treasury Yield Closes on 6-27-2014: U.S. Stocks and Gold in Consolidation. Rates Down.

A Market Timing Report based on the 6-27-2014 Close, published Sunday June 29, 2014

The SP500 Index has recovered from a recent swoon, but has been consolidating for eight market days.  The Bulls will need a brand new high to keep this market moving to our current target of 1993 at the upper trend line.  The Bears remain frustrated as even the previously overvalued small caps have regained much of what was lost from the March highs.  This makes zero sense, so I suspect that the re-inflation of small cap stock prices (RUT, IWM) is marking the approximate end of this move.

We’ve been raising some cash and have sold entire index allocations in some cases.  To see my allocations by percentage and pending SELLs, simply subscribe here for free: Free Subscription to My Newsletter and access to My Latest Comments/Strategy.

Here’s the SP500 Index Chart (click to enlarge):

sp500-index-market-timing-chart-2014-06-27-close

SP500 Consolidating Slightly Above Prior Breakout

Gold (GLD) is holding up well, but could be subject to correction.  Remember that when stocks correct strongly, which they will eventually, and probably sooner rather than later, metals often sell off too, particularly if they have run up with stocks.

The Gold ETF Chart (GLD; click to enlarge the chart):

gld-gold-etf-market-timing-chart-2014-06-27-close

Gold holding its gains, but is not invulnerable to correction.

The 10 Year Treasury Interest rate (TNX, tracked by TLT if Bullish; TBT if Bearish) is falling again, which is a negative sign for the SP500 Index (click to enlarge):

tnx-10-year-treasury-note-market-timing-chart-2014-06-27-close

Rates are falling again.

Why is this a poor prognostic sign?  Because rates are falling due to a very weak GDP report in the first quarter and the belief that the Federal Reserve will slow down their time table of QE reduction and the raising of rates so as to help stimulate a faltering economy that could otherwise deliver poor earnings and raise PE’s even further.  Valuations then come down as the markets sell off a bit. 

Since the Fed is going to likely remain supportive, a huge drop as we saw in 2011 is probably not likely, but we won’t make assumptions, and we’ll have our exits planned.

Have a wonderful July 4th Week if you are from the United States and celebrate freedom wherever you are!  The desire for freedom is shared by the entire world.

But don’t miss out on my comments on Twitter® or StockTwits® where my buys and sells are posted.  You can read my Tweets whether you have a Twitter account or not: Follow Me on Twitter®.   Follow Me on StockTwits®.

Standard Disclaimer: It’s your money and your decision as to how to invest it.

I thank Worden Brothers for the chart system I use to post these charts.  If you want to know more about the charting system I use every day, go to my “Other Resources” page here:  Other Resources   It makes it much easier to follow along with me if you can see the charts and manipulate them on your own computer, so it’s a great investment to have an excellent charting system.

Copyright © 2014 By Wall Street Sun and Storm Report, LLC All rights reserved.

Posted in Bonds, gold, investment, large cap stocks, S&P 500 Index, Treasuries | Tagged , , , , , , , , , , , , | Leave a comment

Market Timing Brief for the SP500 Index, Gold and Treasury Yield Closes on 6-20-2014: Stocks Break Out Again. Gold Rallying. Rates Sideways.

A Market Timing Report based on the 6-20-2014 Close, published Saturday June 21, 2014

The SP500 Index has established a brand new breakout above the prior breakout high.  The Bulls have the ball.  The upside to next resistance is at about 1985 (not the year of course, the number).  Markets tend to move in waves making higher lows and higher highs in a Bull market.  Sometimes they just keep gradually going up, but that is fairly uncommon.  What this means is that we must tolerate some volatility to make money in stocks.  We are now fully invested, but have more foreign market exposure than U.S. exposure at the moment due to the lower valuations abroad.  To see our allocations by percentage, simply subscribe for free here: Free Subscription to My Newsletter and access to My Latest Comments/Strategy.

Here’s the SP500 Index Chart (click to enlarge):

sp500-index-market-timing-chart-2014-06-20-close

SP500 Index: The Bulls have more upside

Gold (GLD) rallied strongly after the Fed FOMC announcement this past week (they lowered QE by 10 billion in total), so our recent entry is working (click to enlarge the chart):

gld-gold-etf-market-timing-chart-2014-06-20-close

Gold is making more progress since the Fed reassured the markets.

The 10 Year Treasury Interest rate (TNX, tracked by TLT if Bullish; TBT if Bearish)  (click to enlarge):

tnx-10-year-treasury-note-market-timing-chart-2014-06-20-close

Rates go sideways after the Fed statement.

There were no rate fireworks post-Fed announcement.  The market seems satisfied that the Fed will control the range of rates within reason.  But the real issue is what will happen when the Fed is no longer buying more Treasuries back than are being issued by the Treasury Department.  That inflection point may drive rates up at least moderately, and as QE will end in October, the inflection point could occur before then.

That said, some seasoned investors who have been correct about interest rates for many years now, contend that the decline in rates is not yet over.  One prominent voice in that direction is Gary Shilling.  Since he’s been right, we need to take note that he may continue to be correct.  If he’s right, both the bond and the stock market will continue to do fine.  Overvaluation will be dealt with along the way, but those companies who are rewarding investors with strong earnings, buybacks, dividends, and debt reduction will do well.

The other big wild card out there is Iraq.  The terrorists are advancing as our leadership says the Iraqis must step up and face ISIS or we can’t help them.  ISIS knows that Americans are weary of war.  Yet the trillions we spent and the sacrifices of the young men and women we’ve lost and who have been injured could be unraveled if we fail to act.  Unfortunately, more war spending would hardly help our Treasury balance, putting direct further financial strain on our system.  The markets could react negatively as things develop.  It would be great if the Iraqis could unite against this massive threat.  Risk rises if they don’t.

Don’t miss out on my comments on Twitter this week.  You can read my Tweets whether you have a Twitter account or not: Follow Me on Twitter

Standard Disclaimer: It’s your money and your decision as to how to invest it.

I thank Worden Brothers for the chart system I use to post these charts.  If you want to know more about the charting system I use every day, go to my “Other Resources” page here:  Other Resources   It makes it much easier to follow along with me if you can see the charts and manipulate them on your own computer, so it’s a great investment to have an excellent charting system.

Copyright © 2014 By Wall Street Sun and Storm Report, LLC All rights reserved.

Posted in Bonds, gold, investment, large cap stocks, S&P 500 Index, Treasuries | Tagged , , , , , , , , , , | Leave a comment

Market Timing Brief for the SP500 Index, Gold and Treasury Yield Closes on 6-13-2014: Stocks Fail a Breakout. Gold Rallies. Treasuries at a Pivot Point.

A Market Timing Report based on the 6-13-2014 Close, published Sunday June 15, 2014

The SP500 Index has finally failed to hold an important breakout above an upper channel line indicated by the second yellow line from the top on the chart below.

Here’s the SP500 Index Chart (click to enlarge):

sp500-index-market-timing-chart-2014-06-13-close

SP500 Index Fails a Breakout

Until the Bulls reclaim the yellow line we are just below now in the chart, the Bears have the ball and we could fall to any one of the targets marked by the aqua arrows in the chart.  The 50 day moving average is at the middle aqua arrow shown.  To find out about all of my market allocations at the moment, please subscribe here: Free Subscription to My Newsletter and access to My Latest Comments/Strategy  There is one market in particular that you don’t want to be a part of for the time being and the allocation list makes that clear!

If the Bulls do regain the last breakout, 1979 would be the next SP500 Index upside target.  It will be interesting to see if the Fed changes its policy direction or if it continues on its stated path of lowering QE and ignores the recent soft GDP and housing numbers.

Gold (GLD) has continued to rally after our recent buy (Tweeted), but has reached a resistance point as the chart shows (click to enlarge the chart):

gld-gold-etf-market-timing-chart-2014-06-13-close

Gold still in rally mode.

The 10 Year Treasury Interest rate (TNX, tracked by TLT if Bullish; TBT if Bearish) has stalled just below the 50 day moving average, which has now become a “pivot point” as the chart shows (click to enlarge):

tnx-10-year-treasury-note-market-timing-chart-2014-06-13-close

10 Year Treasury Note at a Pivot Point

Rates look like they have entered a pattern very similar to that appearing at the end of April.  The yield has stalled around the 50 day moving average.  The Fed could throw a big monetary monkey wrench into things this Wednesday with their meeting announcement on FOMC policy and also at the dog and pony show at 2:30 pm ET by Chair Janet Yellen.

The market will respond to anything substantive done by the Fed this Wednesday.  The ECB came up short recently with their policy announcements and disappointed the market.  Things are probably not dire enough for a big dovish shift in policy, but there are those betting on it with real money.   The Fed has been lowering QE and rates have FALLEN, not risen, because the Fed has continued to buy up even more of the debt that the Treasury has been issuing as explained last week, but the QE equilibrium could shift to a net tightening as the program is reduced even further.   If the Fed continues QE without hesitation this Weds. the market may start to sell off some bonds and drive rates up.  We may see the 10 Year rate go sideways until Wednesday as it waits for the Fed statement.

I don’t know about you, but I’m tired of having our government front the easy money for the rest of the world.  Are we going to allow the ECB sit back while we further destroy our currency?

Standard Disclaimer: It’s your money and your decision as to how to invest it.

You’ll miss out on some of my comments, but not if you follow me on Twitter where I comment regularly: Follow Me on Twitter

I thank Worden Brothers for the chart system I use to post these charts.  If you want to know more about the charting system I use every day, go to my “Other Resources” page here:  Other Resources   It makes it much easier to follow along with me if you can see the charts and manipulate them on your own computer, so it’s a great investment to have an excellent charting system.

Look for updates this week as needed via Twitter.

Copyright © 2014 By Wall Street Sun and Storm Report, LLC All rights reserved.

Posted in Bonds, gold, investment, large cap stocks, S&P 500 Index, Treasuries | Tagged , , , , , , , , , , | Leave a comment

Market Timing Brief for the SP500 Index, Gold and Treasury Yield Closes on 6-06-2014: Stock Market Breakout. Gold’s Early Tentative Rally. Rates Rising Again.

A Market Timing Report based on the 6-06-2014 Close, published Sunday June 8, 2014

As Ben Bernanke collects his millions and millions in speech fees having decimated the poor who bothered saving through his near zero interest rates,  the SP500 Index (SPX, SPY) is at a new breakout high.  And we’ve added to our prior position.  That’s not a political statement, but a statement of fact.  If you want to know what percent exposure we are at in U.S. large, mid and small caps and in other markets around the globe, including a very recent European addition, subscribe here:  Free Subscription to My Newsletter and access to My Latest Comments/Strategy

Resistance is only 1.26% higher at around 1974 for the SP500 index.  1974.  Interesting that the SP500 Index low was 666 in 2009 and we’re up 196% from there.  Those numbers are numbers you and I should sit with and meditate upon, as they are living proof that markets come back and in general have the tendency to go up over time more than they go down, especially when given ample help by the Federal Reserve.  We attempt to find better entry points and exit points, but to be successful, we must stay invested until we get the clearer signals.  Or if not, we need to have other ways to counter the effects of inflation on our portfolios.

Here’s the SP500 Index Chart (click to enlarge):

sp500-index-market-timing-chart-2014-06-08-close

SP500 Index is Headed to the Top Yellow Channel Line

Speaking of inflation, there is not enough of that in Europe, according to Mario Drahgi of the European Central Bank, so he moved one of the bank’s interest rates to a negative number.  That has no practical consequence, because there is very little money exposed to those negative rates, but it did indicate that he’s attempting to be creative about increasing European inflation above current levels. The ECB also intends to buy bonds composed of small business loans to stimulate lending (ABC News on ECB: Not the Usual QE).

The other central banks have bought government bonds to lower interest rates directly, but the ECB is balking on that.  The Euro actually rallied somewhat, after the news came out.

Following the ECB news, gold (GLD) (click to enlarge) rallied a bit, but the rally is not entirely convincing and could stall as low as the 50 day moving average.   Notice how the 50 day just crossed below the 200 day moving average.  This is a negative technical signal, so our recent gold buy (see link above to see what we did), is very much a trade.  We maintain a long term GLD position as a form of monetary insurance, and even there, we set limits on how much we’ll give back to the house.  Betting on disaster is a bet that favors the house, so we protect profits at certain levels.

gld-gold-etf-market-timing-chart-2014-06-06-close

GLD (gold ETF) rallies a bit after the ECB took action.

The 10 Year Treasury Interest rate (TNX, tracked by TLT if Bullish; TBT if Bearish) continues to move up over further resistance levels as this week’s chart shows (click to enlarge):

tnx-10-year-treasury-note-market-timing-chart-2014-06-06-close

Rates are Rising Again

Rates on the 10 Year Treasury (used to establish important interest rates) did fall back from the 50 day moving average, so the picture is mixed still.  Holding the recent lows was positive for higher rates, but failure at the 50 day moving average was not.  We expect financials to do well as long as rates keep moving up from here (XLF).

Standard Disclaimer: It’s your money and your decision as to how to invest it.

I also comment regularly on Twitter: Follow Me on Twitter

I thank Worden Brothers for the chart system I use to post these charts.  If you want to know more about the charting system I use every day, go to my “Other Resources” page here:  Other Resources   It makes it much easier to follow along with me if you can see the charts and manipulate them on your own computer, so it’s a great investment to have an excellent charting system.

Look for updates this week as needed via Twitter.

Copyright © 2014 By Wall Street Sun and Storm Report, LLC All rights reserved.

Posted in Bonds, gold, investment, large cap stocks, S&P 500 Index, small cap stocks, Treasuries | Tagged , , , , , , , , , | Leave a comment

Market Timing Brief Video for the SP500 Index, Gold and Treasury Yield Closes on 5-30-2014: SP500 Index in New Breakout. Gold Down. Treasury Yields at New Recent Lows.

A Market Timing Report based on the 5-30-2014 Close, published Sunday June 1, 2014

The SP500 Index (SPX, SPY) reached a brand new all time breakout high this week, delaying the inevitable next correction for now.  Please view my latest YouTube® video by clicking on the video (or in an email click on the top email link and then the video itself) on the US stock (SP500), gold (GLD), and interest rate market (TNX) charts here and then read below the video for a few additional points (remember that it’s your money and therefore your decision as to how to invest it):


A Few Additional Comments and Two More Market Timing Charts:

1. Due to the level of sentiment we saw last week, (Access it here:  Subscription to My Newsletter and access to My Latest Comments/Strategy  I’ll send you back the password to the access page and the weekly newsletter in the same email), the market could make a marginal new high, even ascending to that upper channel and then fail and fall below the last breakout.

2. Gold is NOT in a good buying position.  The trend is still down, so we’re standing aside.  We’ll buy higher if needed, but this pullback as described in the video has been too much.  I did not sell my longer term position in which I’ve already sold my principle (riding profits).  This refers to my trading position.

3. Interest rates falling to new recent lows through major support is striking (TNX, TLT, TBT).  This is NOT what nearly everyone was expecting after the taper program began, but I explained why it may be happening in the video.

4. Small caps (RUT, IWM) did NOT rally with the SP500 Index on Friday and I shorted the Russell 2000 Index on Friday as mentioned on Twitter (you can short directly if you have 50K to do it with or use the inverse 1X or more ETFs.  I personally stick to the 1X negative ETFs; it’s a hedge, not wild speculation).   I realize that shorting, regardless of the vehicle, is not for everyone, and it can be tricky shorting down trends as the bounces can be painful when they occur unannounced, but if it does not work, it’s just a partial hedge against a sell off.  Since small caps are still selling off, it’s a reasonable position to take.

Take a look at the under-performance in small caps vs. large both very recently (yes, Friday’s decline is subtle on the chart, but the Russell 2000 (yellow line) was headed down while SPX (main plot) was headed up a bit on Friday as you see) and since earlier in the year, it’s been even worse and quite obvious as the second ™chart shows.  Since the small caps have been under-performing since earlier this year, the first sign of trouble we saw on Friday could be the beginning of the next down move.

Small caps (yellow) were down 0.49% on Friday vs. + 0.16% for the Large Caps:

sp500-index-spy-spx-vs-russell-2000-index-RUT-iwm-market-timing-chart-2014-05-30-close

SP500 Index vs. Small caps (Russell 2000 Index) showing Small Caps going down while Large Caps rally.  Yes, it’s subtle on the chart, but they were headed in opposite directions on Friday.

Since 1-15-2014, Large Caps (main plot) vs. Small Caps (yellow line):

sp500-index-spy-spx-vs-russell-2000-index-RUT-iwm-market-timing-chart-2-2014-05-30-close

Small Caps have been under-performing Large Caps.

I have a brand new monthly issue out today, so be sure to sign up for the free market timing newsletter using the link just under the video.

Standard Disclaimer: It’s your money and your decision as to how to invest it.

I also comment regularly on Twitter.   Look for updates this week as needed via Twitter. Follow Me on Twitter

I thank Worden Brothers for the chart system I use to post these charts.  If you want to know more about the charting system I use every day, go to my “Other Resources” page here:  Other Resources   It makes it much easier to follow along with me if you can see the charts and manipulate them on your own computer, so it’s a great investment to have an excellent charting system.

Copyright © 2014 By Wall Street Sun and Storm Report, LLC All rights reserved.

Posted in Bonds, gold, investment, large cap stocks, S&P 500 Index, small cap stocks, Treasuries | Tagged , , , , , , , , , , , , , | Leave a comment

Market Timing Brief for the SP500 Index, Gold and Treasury Yield Closes on 5-23-2014: US Stocks Near Breakout. Gold Moves Sideways but Rates Are Bouncing.

A Market Timing Report based on the 5-23-2014 Close, published Monday May 26, 2014

The SP500 Index (SPX, SPY) did rally, disappointing those who are Bearish.  The problem is that the reasons stocks started pulling back (particularly the 0.1% GDP growth number from the first quarter) are still intact and money is going into bonds predominately and much less into stocks.  So you have to be selective as I’ve been doing by holding both Microsoft (MSFT) and Apple (APPL) for example (from lower levels).  Finding value is important in a lower growth environment, and growth stocks, particularly the small caps, remain vulnerable.

Here’s the SP500 Index Chart (click to enlarge):

sp500-index-market-timing-chart-2014-05-23-close

SP500 Index above prior resistance and just below prior intraday high.

The market could be moving up out of the range it’s been stuck in since March.  If the SP500 can move above 1902.17 convincingly, it could then head to the upper yellow trend line which is at about 1961 currently (see chart above).  In the meantime, the small caps (Russell 2000 Index; RUT; IWM) indeed are continuing to bounce from support as pointed out last week as a positive sign.  Market breadth usually goes hand-in-hand with a strong stock market rally, but the small cap bounce may be short lived due to the recent valuation concerns in the face of slower growth.

In the meantime, gold (GLD) continues in stuck mode (click to enlarge):

gld-gold-etf-market-timing-chart-2014-05-23-close

Gold is holding support, but rates are bouncing and the US Dollar is edging up.

NOTE (5-27-2014): 122.84 is the intraday low to watch today. A close below there brings more damage (loss of 2014 profits; so use a stop!)

The 10 Year Treasury Interest rate (TNX, tracked by TLT if Bullish; TBT if Bearish) has finally bounced from 2.471% yield support as shown on the chart (click to enlarge):

tnx-10-year-treasury-note-market-timing-chart-2014-05-23-close

Rates hit bottom and are starting to rise again.

Rates are moving back up from the major support level reached on 5-15-2014.  The US dollar is also edging up now and that could pressure gold, particularly if the Ukraine situation calms down.   The European Central Bank is taking further action to weaken the Euro, the news says today, and that will bolster further dollar strength and could weaken gold unless inflation remains a concern, which it is at the moment.  So you see the equation is very complex.  So we go by the charts to get the market’s summary statement: Gold is still a hold.

We just sold an index based on the move up in interest rates.  You can catch up on our allocations to various markets here:  Free Subscription to My Newsletter and access to My Latest Comments/Strategy  I’ll send you back the password to the access page and the weekly newsletter in the same email.

Standard Disclaimer: It’s your money and your decision as to how to invest it.

I also comment regularly on Twitter: Follow Me on Twitter

I thank Worden Brothers for the chart system I use to post these charts.  If you want to know more about the charting system I use every day, go to my “Other Resources” page here:  Other Resources   It makes it much easier to follow along with me if you can see the charts and manipulate them on your own computer, so it’s a great investment to have an excellent charting system.

Look for updates this week as needed via Twitter.

Copyright © 2014 By Wall Street Sun and Storm Report, LLC All rights reserved.

Posted in Bonds, gold, investment, large cap stocks, S&P 500 Index, small cap stocks, Treasuries | Tagged , , , , , , , , , , , , | Leave a comment

Market Timing Brief for the SP500 Index, Gold and Treasury Yield Closes on 5-16-2014: Stocks Found Some Support. Gold Struggles as Rates Fall.

A Market Timing Report based on the 5-16-2014 Close, published Sunday May 18, 2014

The SP500 Index (SPX, SPY) finally found some support and having broken down below the right shoulder of the head and shoulders formation and is moving up from the first level of support just below the 50 day moving average to test the right shoulder again (green line in the chart below).  The low reached in the decline this past week was 1862.36.

Here’s the SP500 Index Chart (click to enlarge):

sp500-index-market-timing-chart-2014-05-16-close

SP500 Index Still Faces the Right Shoulder as Resistance.

If the SPX makes it over the green line, we could see a brand new all time high, even an extension of the rally to the yellow up trend line (that is cut off on the above chart, but is at about 1956.5ish right now).  With slowing corporate earnings based on weak GDP growth in the first quarter, I expect whatever bounce is generated from here to be truncated.  But at the moment, investors seem to feel the economy is thawing from a slow wintery first quarter and so it may rally despite the poor GDP results.

In addition, I cannot rule out a further rally in the SPX because the Russell 2000 (small caps; see comparison chart from last week) recovered from a breach of a major low formed by the lows from mid-April to last week’s low.

Note that as far as the SP500 Index (SPX, SPY) goes, and it has not fallen nearly as much as the small Caps RUT, IWM), it fell back to a similar level just below the 50 day moving average on the past two pullbacks.  Furthermore, ONE of the sentiment scenarios I outlined this week fits the current pullback.  This means the Bears cannot get too cocky here.

But I expect with the soft data recently, combined with the more negative scenario in the sentiment data (see my “WSSSR Access” page on SunAndStorm.com), we could have a bounce here followed by another down-wave as we saw in the beginning of April (one wave down, two up, three down).  We officially have 79% of our “maximum” equity exposure, 1though we are holding less in the RELATIVELY overvalued U.S. markets.  Large caps are the least overvalued, so you may be able to just ride these waves out in the SP500 Index.  The Russell 2000 has corrected, but may not have found its final low.

In the meantime, gold (GLD) is stuck as well, stuck in a range from which it needs to break out (click to enlarge):

gld-gold-etf-market-timing-chart-2014-05-16-close

Gold is just plain stuck! But it’s not selling off either. Hold your gold for now with a stop.

The 10 Year Treasury Interest rate (TNX, tracked by TLT if Bullish; TBT if Bearish) are testing an even lower low, breaking down from the prior range, so let’s look at the 10 Year Treasury Yield below (click to enlarge):

tnx-10-year-treasury-note-market-timing-chart-2014-05-16-close

Rates fell to a new recent low but are on support.

Gold “should” have rallied on the Treasury market strength and it’s a concern that it didn’t.  It must hold the lowest support line on the chart above.

NOTE: One other important point about this Treasury rally is that it is being accompanied by dollar STRENGTH as opposed to dollar weakness.  Sometimes as rates fall a currency is considered less attractive, but now rates are falling and investors are still buying dollars.  That means there is a fear trade that is motivating dollar buying and perhaps some of that is due to the Ukraine.

You can catch up on our allocations to various markets here:  Free Subscription to My Newsletter and access to my latest comments/strategy  I’ll send you back the password to the access page and the weekly newsletter in the same email.

Standard Disclaimer: It’s your money and your decision as to how to invest it.

I also comment regularly on Twitter: Follow Me on Twitter

I thank Worden Brothers for the chart system I use to post these charts.  If you want to know more about the charting system I use every day, go to my “Other Resources” page here:  Other Resources   It makes it much easier to follow along with me if you can see the charts and manipulate them on your own computer, so it’s a great investment to have an excellent charting system.

Look for updates this week as needed via Twitter.

Copyright © 2014 By Wall Street Sun and Storm Report, LLC All rights reserved.

Posted in Bonds, gold, investment, large cap stocks, S&P 500 Index, small cap stocks, Treasuries | Tagged , , , , , , , , , , , , | Leave a comment