Market Timing Brief for 1-11-2013: Will Earnings be Enough? And What the 2013 Stars Could Be.

A Market Timing Report based on the 1-11-2013 Close published Sunday January 13th, 2012

UPDATE 1-14-2012 @ Close: The SP500 Index pulled back a bit before the President’s speech and then recovered to about flat.  The overhead resistance shown in this week’s chart remains a challenge.  Big tech was weaker, because Apple was selling off due to lower part orders, which are tracked by the analysts to get any clue they can to guess at Apple sales numbers.  Apple dropped below 500 today and then closed just above it.

In his news conference today, the President seemed to imply that he would not default on the debt, but rather would shut down parts of the government including defense if his hand is forced.  Even though we all know this must be fixed before the debt ceiling deadline, the market may become nervous again and give us another buying opportunity.  I have begun some selling already and will do more selling to protect profits as needed. 

Tech (QQQ, NDX) is one market that is looking like a double top and is in danger of filling the post-fiscal cliff gap as I called it today on Twitter.  The gap is shown within the white circle on the chart. One of the reasons Big Tech may sell off now is that government spending cuts are going to bring down tech company earnings as a general trend.  Some companies will escape the knife of course.  The chart is just below:

qqq-market-timing-chart-2013-01-14-close

Big tech (QQQ, NDX) starting to form a top?

Now for this week’s issue….

We’ll get to that first question in a second, but first, let’s talk about what looks strong going into this New Year.  This issue took me longer than usual to write, because I had to look through all the charts yet another time to pick out my “2013 favorites.”

First there is biotech (BTK) that is staging a brand new breakout.  It was a favorite of mine last year and it panned out to the tune of 50.1%.  The overall market is a bit stretched, so this may not be the best buying point; however, the fundamentals behind it continue to be the need of drug companies to buy the new products that are coming repeatedly from biotech firms.  Big drugs (DRG) are also breaking out again and could head to the 2000 highs under the momentum of the “legal drug business.”

The banks were another favorite of mine last year and there is still room for a run up this year as balance sheets get better and better based on your savings and mine (BXK, XLF). 

And then there was housing also among the living dead last year.  Although the current run up looks like it’s just about the same length as the last one, so this leg could end soon, the market is still technically a Bull as the chart shows below.

Another point is that although there is still plenty of room for housing to run to the upside it would appear, but remember that housing was overdone in 2007 and the excesses are still not entirely out of the various markets across the country.   For this reason, I expect the housing index (HGX) to have some trouble getting above 186.82 which was the low in July 2006.  Here is the chart:

hgx-housing-index-chart-2013-01-14-close

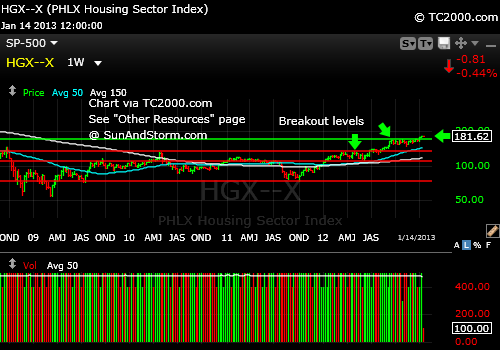
Housing was extremely strong in 2012 as predicted, but it’s no longer among the “Living Dead” as I called it a year ago.

All Charts are courtesy of the Worden Brothers TC2000 Charting system, which I love and have used since April 19th, 2001 and it’s continually improving: My Charting System

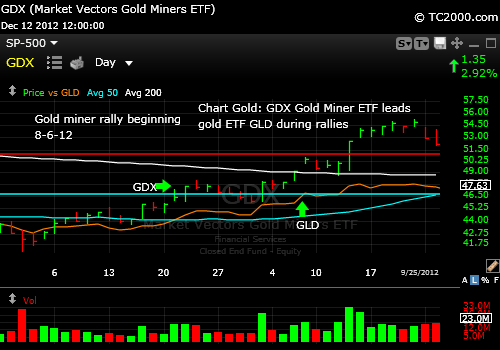
Gold (GLD) and gold stocks (HUI, GDX) have been correcting since October and September, respectively.  They have held recent support, so it’s possible that a rally could start from about here.  The challenge for the Bulls has been that there have been 5 mini-rallies during the decline, all of which have failed to date.  That is true even for the last blip up last week.   Be sure to see the update on the gold miners on the main website posted 1-15-2013 (click one of the links via the link above and then see the button on blue bar which says “Gold Miners”).

Oil stocks (XOI) have been rallying and could easily run to the Sept. high.

Emerging markets (VWO) are still strong and both Australia (EWA) and Canada (EWC) are looking better.  Because China (FXI) is in correction at the moment, VWO may pull back a bit, so we may have to average out and re-enter.  That is, those of us that don’t like to watch our gains dissolve away in the waves.  I expect China to resume its up trend in a bit and emerging markets to outperform the US markets this coming year.

Remember Australia and Canada have stronger fiscal policies and somewhat stronger currencies than the United States (except in times of extreme panic), so that could give them an edge.  I’ll share a critical insight.  Don’t bother buying VWO, EWA and EWC all at the same time.  They are all highly correlated and have been so since 2005.  There is no big laggard here, but EWA and EWC are lagging a bit and would be a better buy.  They will pull back with the U.S. market if U.S. earnings are poorly received.  Keep that in mind.  I also keep an eye on the currencies to make sure there is no negative move developing.  You can see my trades on Twitter.

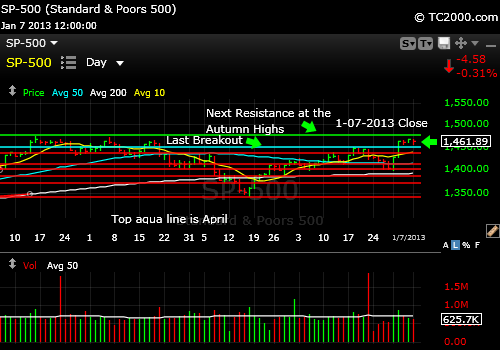
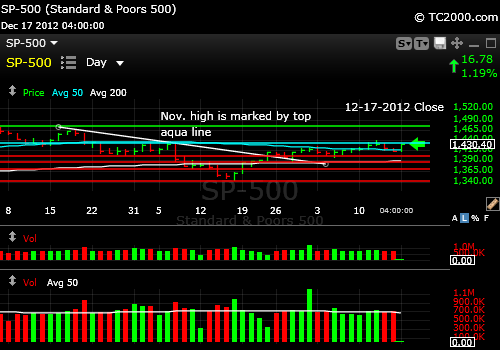
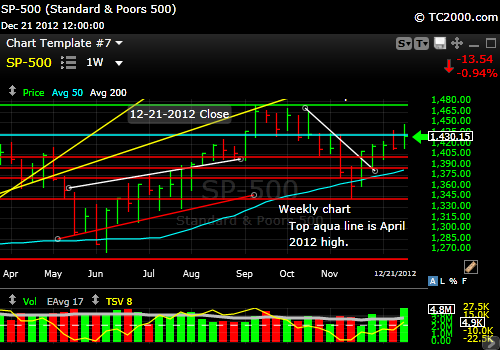
Earnings reports are starting to trickle in, but soon they’ll be pouring in.   So far there are mixed results and a muted response either way.  This is shows vividly on the SP500 Index market timing chart this week.

Market Timing Charts (opens separate window so you can access all the charts at once)

That green line is your “market tell” for the week and you may see more of a battle around that line on Monday.  The market is going to make a thumbs up or down decision soon.  Watch the current tops.  If they hold the current rallies in check, it’s a negative sign.

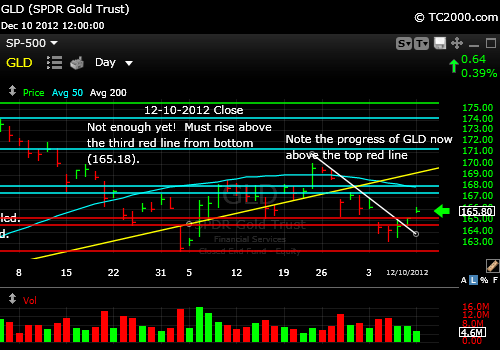
More on gold now.  The number one secret to successful gold investing is to understand that it’s not the degree of inflation that matters, but rather the spread or difference between the inflation rate and prevailing interest rates like the 10 year Treasury Note yield shown in the Bonus Chart of the Week you can access at the link above.

When real interest rates are negative as they are now, gold does well.  We have ridiculously low interest rates in the face of greater inflation than can be covered by that interest.  The fact that gold has been weak while the central banks worldwide are going crazy still with their printing presses may be because the world is expecting a gradual but steady rate of economic healing as well as the fiscal healing of outrageous government debt levels; hence, the weakness shown in the chart (please access chart via the link above).

When the world understands that there is far more damage to be unwound that is being hidden beneath the surface by the banking system as well as by the Fed in taking on a massively inflated Fed balance sheet of bad mortgages, gold will resume its up trend.  The Fed has taken on weighty bad debt and the risk that goes with it from the banks and placed it on your shoulders and mine.

As mentioned last week, the VIX needs to move definitively below the August low of 13.30 and finished Friday at 13.36, so there this would be the time for a new VIX low.   Without an immediate fall in the VIX, a top will be in place for the SP500 Index.

Finally, investor sentiment, namely the AAII survey of Individual Investor Sentiment says to me that there are too many Bulls at the moment, not at a huge extreme, but meeting the same state as on 12-20-2012, so sentiment predicts a correction from here to around 1430ish by my reading of the chart.  The Bull Bear spread is 19.5% this week up from 2.5% in just one week.  That’s too much too fast.  No number is a perfect predictor, so follow the charts and see if the current highs hold or if there is a feeling conveyed by the stock market action implying “blue skies ahead for 2013.”

Standard Disclaimer: It’s your money and your decision as to how to invest it.

The above is the text from this week’s free report.  To receive future reports ahead of publication of the text shown above AND much more market timing information, please subscribe for free here:

Free Subscription to My Weekly Newsletter

If you “liked” this post, would you please “Like” it at the “Share” arrow below?  Thanks very much!

And to follow my Buys and Sells and up to the minute insights, please follow and bookmark my Twitter feed here: Join Me on Twitter

Copyright © 2013  By Wall Street Sun and Storm Report, LLC All rights reserved.

Posted in Biotech, fiscal cliff, gold, gold etf, gold stocks, inflation, investment, investor sentiment, large cap stocks, Market timing, mining stocks, pharmaceutical stocks, S&P 500 Index, trading, US Stocks, volatility index | Tagged , , , , , , , , , , | Leave a comment

Market Timing Brief for 1-04-2013: After the Fiscal Cliff. Now what?

A Market Timing Report based on the 1-04-2013 Close published Sunday January 6th, 2012

UPDATE 1-07-2013 after the close: Today’s little pullback was “noise.”  The market stayed within the market timing price range of the prior two days as shown on the chart below.  In fact, it can retest the breakout at the top aqua line and then rally.  The real issue is whether earnings will turn this into a temporary top in the market or allow for a breakout.  More aggressive traders could sell some or all of their positions as close to the recent high as possible and rebuy a higher close above the overhead resistance line shown below. 

I personally will be protecting a good percentage of the accrued profits during this last run up, while maintaining a smaller core position should the market sell off significantly.  All my stops are written down, and I suggest that you consider doing the same.  Where you set them is personal to your plan.  Having a plan is very effective in battling the emotions we may feel when we’re “in the clutch.”

sp500-index-market-timing-chart-2013-01-07-close

The SP500 Index is within the range of the prior two market days, so there is no breakdown yet.

And now this week’s issue…

After the cliff comes the debt ceiling debate.  Don’t be fooled by that debate either.  The issue is not whether or not we are going to pay our bills.  Anyone messing with Mother Global Bond Market will have hell to pay.  Congress would not dare to default on our debts, but they will grandstand a lot and even Obama will be shamed into some degree of compromise.  The issue behind this that Rick Santelli regularly rants about on CNBC is that we have far too much debt and to not deal with it even in the face of a slowing economy will cause even more pain later.  That is what Rick thinks.  What do you think?  Tweet me a comment on Twitter!

The SP500 Index (SPX, SPY) is set up now for a retest of the autumn highs as shown in this week’s chart:

Market Timing Charts for Sunday’s Issue are Here (opens separate window so you can access all the charts at once)

The thing to watch every earnings season is how stocks react to the current earnings AND to the projections.  If they are both a bit soft and the market rallies, the Bulls will win.  Markets do not like big surprises though, so if there are a series of big misses the Bears will have their day.  I do not believe that this will be the case, except for some retailers who are still hiding their results prior to the quarterly report.

The next issue on the table is familiar to many of you, but could be the source of the next Bull leg in the markets.  Bonds are the basis for that next leg, if they continue to sell off as they have recently.  I go over the details here and show you the chart at the link above (Bonus Chart of the Week link).

The other consequence of the rise of the 10 Year Treasury Note to which many mortgages are tied is that housing sales could be artificially stimulated via a further rise in rates.  For that to happen, the Fed will have to sit on its hands and stop buying Treasuries as much as they’ve been doing.

Gold (GLD) investors are tiring a bit after little progress for the past year and half.  The down trend line that could not be broken to the upside remains the nearby resistance as the chart shows (see above link)

The fact that the gold mining stocks (GDX) held on by a thread last week in the presence of gold weakness was impressive.  Perhaps the end of the selling is in sight.  If not, the 2012 lows look like a reasonable next downside target.

How are investors feeling lately sentiment-wise? The AAII survey shows that the Bull Bear spread dropped to 2.5% from 14.2% the prior week.  Now the data matches that of 8-30-2012.  We could still have a rally lasting 1-2 market weeks followed by a significant decline.  When the spread falls to MINUS 15 – 20%, the correction will be under way.  Before that there could be a few weeks of forming a top by easing back a bit, rallying and then easing back.  The first or second retest of the top would then fail.  The October 2012 decline was preceded by a -15.9% spread (Bear % outnumbering Bull % by that margin).

Volatility (VIX) has collapsed back to the numerous 2012 lows, so we need a VIX breakout to the downside (further big drop in volatility) for the SP500 Index to rally back to the 2007 high.

I’ve updated the so called long term signals in the MTT below, which is done on a monthly basis.

In summary, watch the response of investors to upcoming earnings and be prepared to take some profits within a week or two if you prefer to market time at least part of your holdings as I do.  However, if there is a new breakout of the SP500, you may want to see if that holds before selling.

Standard Disclaimer: It’s your money and your decision as to how to invest it.

The above is the text from this week’s free report.  To receive future reports ahead of publication of the text shown above AND much more market timing information, please subscribe for free here:

Free Subscription to My Weekly Newsletter

All Charts are courtesy of the Worden Brothers TC2000 Charting system, which I love and have used since April 19th, 2001 and it’s continually improving: My Charting System

If you “liked” this post, would you please “Like” it at the “Share” arrow below?  Thanks very much!

And to follow my Buys and Sells and up to the minute insights, please follow and bookmark my Twitter feed here: Join Me on Twitter

Copyright © 2013  By Wall Street Sun and Storm Report, LLC All rights reserved.

Posted in fiscal cliff, gold, gold etf, gold stocks, investment, investor sentiment, large cap stocks, Market timing, S&P 500 Index, trading, US Stocks, volatility index | Tagged , , , , , , , , , | Leave a comment

Market Timing Brief for 12-28-2012: Throw Out the Rule Book for the Fiscal Cliff Correction

A Market Timing Report based on the 12-28-2012 Close published Sunday December 30th, 2012

UPDATE 1-3-2013 @ 3:00 pm: GLD (see chart below) fell back due to the Fed news that several members believe QE3 will end in 2013.  That was revealed in the minutes.  The US dollar promptly rallied and gold fell.  Short term GLD will probably pull back more, but there is some support at the 200 day moving average. 

There is no way to entirely protect yourself against such “jerks” in the market that are due to the release of Fed notes and the like other than to be diversified and pay attention to sell signals when they arise. The prior reversal UP above the 11-02-2012 low has been reversed by a move to the downside. 

There was a hint in the trading yesterday that gold was not as strong as it could be.  I mentioned on Twitter yesterday that GLD had turned down from the daily down trend line (down sloping white line below).  That was negative, because it tells you that there were sellers just waiting to take a relatively small profit.  Today, you have the follow through to the downside based on the Fed minutes.  The downward sloping white line is the daily down trend line and the roughly horizontal white line is the 200 day moving average.  See below.

gld-gold-etf-market-timing-chart-2013-01-03-300pm

Gold market timing signal: White trend line stopped GLD’s climb yesterday.

UPDATE 1-02-2013 @ 9:04 am: This week you get to see the “before” and “after.”  I predicted that the Bears were at risk this week and positioned us to be in the market prior to the cliff resolution, which was a must do for our government.  The patch was done last night and the chart shows the jubilation.  The implied opening per CNBC’s fair value calculation from the market futures is 1452.85 (purple line on chart below) at this time which is above the last high shown on the chart, the 12-19-2012 high.

sp500-index-market-timing-chart-2013-01-02-904am

SP500 Market Futures are Celebrating the Fiscal Cliff Patch Today

Fundamentals don’t work, but technicals do when there is madness in Washington.

So what is the meaning behind that statement?  The meaning is that the way you trade or invest has to fit YOU and your willingness to take the actions that support a particular approach.  To Warren Buffett, it would not matter much if the markets temporarily felt that stocks were worth less than before.  He’d see that as a buying opportunity at a certain point.  In the near term, if the “fiscal cliff” is not resolved, there would be short term pain in the economy, which would screech to a near halt, damaging the fundamental outlook for stocks.

If you had gone strictly by the SP500 Index action this week using market timing, you would have sold promptly upon the break of the November high, perhaps waiting for the close.  But if you have a sense as I do that the fiscal cliff will be patched in time (no guarantee, but I’ll stand by my decision), then you would wait for the rebound and not sell this first sign of weakness (well, there are two signs of such weakness, as the link below explains).

The SP500 Index (SPX, SPY) futures as I type this are down to 1384, 0.91% below fair value as calculated by CNBC despite the “threat of resolution/patch of the cliff.”  This erosion has happened despite the presence of Congress at work on Sunday.  Now the media is reporting that a patch will be done, which is what I wrote last night.   They will not let the medical system collapse by cutting Medicare payments by 25% (100’s of thousands of support staff would be laid off), and they will not let the military fold.  If they do, they’ll all be out of Congress the next time they come to re-election.  Rich people will immediately be paying more.  There is no doubt of that.  Pres. Obama has won that fight.  The rich are easy prey as half our people pay no taxes.

Although technicals work in the face of any sort of madness, you have to trade the way I describe on the SP500Tracker™ page (via link below), which requires too much time for most of us:

Market Timing Charts for Sunday’s Issue are Here (opens separate window so you can access all the charts at once)

Madness means volatility.  The VIX has blasted up based on the indecision at the end of the week and was up 16.69% on Friday.  The VIX is stretched so much on the chart that the next move is more likely down.  The caveat is that there could be one or two more days, generally not more, of even higher volatility in the market.  If volatility falls to relieve the stretch and then the VIX makes a new high, that means more selling is to come.  Often there is a pullback in the VIX for several days after the “stretch is relieved.”

A few other key points this week…

The SP500 Index weekly chart no longer is supportive of a rally, because the week’s close was below the lows of the prior two weeks.

The US dollar is in a weak rally (UUP, USDX).  That is why gold is looking for strength for a reversal upward rather than breaking to new lows.

Emerging markets remain strong (VWO, EEM).

What about sentiment this week?  The AAII survey of individual investors shows that the Bulls dropped only slightly from 46.40% to 44.40% and the Bears rose to 30.2% from 24.8%, so the spread between Bulls and Bears is at 14.2% which is down from 21.6% last week.  To me, as explained on the main website on my AAII sentiment page, this would still allow for a rally soon, which could be followed in turn by a decline in early 2013.  That decline might be based on companies seeing so-so earnings in the fourth quarter.  In fact, retail growth was significantly under expectations.

This week I reveal the “Secret of Small Cap Performance” in gauging the risk of a rally vs. a further correction.   The two charts demonstrate small vs. large cap performance during declines and rallies (see the two charts via the “Bonus Chart of the Week”  link above).

Small caps are thought to behave this way during sell-offs, because they are harder to sell quickly without effecting prices due to lesser liquidity in comparison to large cap stocks.  The small cap outperformance over large caps is one Bull point for this market.

Another hidden silver lining in the market is the Dow Transport Index (DJT, IYT), which is weaker than last week, but slow to participate fully in the correction.  The ever important banking stocks are still holding up as well (BKX, XLF), another point for the Bulls.

Gold is NOT a buy yet this week, but I point out where it IS a buy in this week’s chart (see GLD chart via the link above).

I do not feel there is reason yet to sell long term GLD holdings, due to the state of real interest rates as mentioned previously.  We have no trading position in gold at the current time however.

In summary, the markets are now hostage to your elected government!  While some markets are tipped down, there are glimmers of hope as documented above.  Type in Senate.gov and House.gov into your browsers and call the bums that are responsible for this mess.  Tell them your thoughts, nicely of course!

Standard Disclaimer: It’s your money and your decision as to how to invest it.

The above is the text from this week’s free report.  To receive future reports ahead of publication of the text shown above AND much more market timing information, please subscribe for free here:

Free Subscription to My Weekly Newsletter

All Charts are courtesy of the Worden Brothers TC2000 Charting system, which I love and have used since April 19th, 2001 and it’s continually improving: My Charting System

If you “liked” this post, would you please “Like” it at the “Share” arrow below?  Thanks very much!

And to follow my Buys and Sells and up to the minute insights, please follow and bookmark my Twitter feed here: Join Me on Twitter

Copyright © 2013  By Wall Street Sun and Storm Report, LLC All rights reserved.

Posted in emerging markets, fiscal cliff, gold, gold etf, investment, investor sentiment, large cap stocks, Market timing, S&P 500 Index, small cap stocks, trading, US Stocks, volatility index | Tagged , , , , , , , , , | Leave a comment

Market Timing Brief for 12-21-2012: The November SP500 Index High Two vs. the Bulls Zero.

A Market Timing Report based on the 12-21-2012 Close published Sunday December 23rd, 2012

UPDATE 12-27-2012: The SP500 Index in market timing terms is just above the two nearby support levels of the 12-14-2012 low of 1411.88 and the 50 day moving average now at 1412.84.  I doubt this base will be breached before we know what happens in regard to the fiscal cliff.  Have a look at the weekly chart as well which is referenced in this week’s report (see below).


sp500-index-market-timing-chart-2012-12-27-1005am

SP500 Index Support is nearby and should hold at least until the fiscal cliff question mark is removed.

Above chart showing most recent data at “high power.”

sp500-index-market-timing-chart-2012-12-27-1015am

Higher magnification of SP500 Index chart shown above (10 min later).

UPDATE 12-25-2012: The 12-24-2012 close was still below the critical Nov. 2012 market timing high discussed below in this week’s newsletter, but it is above the base of the upward channel marked by the white lines in the chart below.   Perhaps fiscal sanity will rule following Christmas!  A break below that channel line will bring us to 1400 in a hurry as mentioned last week.

sp500-index-market-timing-chart-2012-12-24-close

SP500 Index below the critical Nov. 2012 high, but still hanging on at the base of the up channel.

The markets as I said remain vulnerable to screw-ups in Washington.  They seem to have a knack for it too!  We’ll allow them to act like adults whenever they finally make that conscious choice, even though recent comments are hardly convincing of this as a likelihood.  Senator Reid insulted Speaker Boehner rather directly last week and then referred to him as “my friend.”  With friends like that, well, you know how that saying ends!  There are just a few days left prior to the cliff, so perhaps the Mayans were just off a couple of days?  It won’t be that disastrous, although it certainly poses a challenge to investors.  The market’s volatility shot up from the lows but was a bit contained on Friday.

The VIX (VIX volatility index) shot up to test the range that has prevailed through the late summer and fall and then failed to make a new breakout high.  That is positive and suggests the US stock market has not yet given up hope for a resolution in Washington.  The other positives include the new high make by the Dow Transports, the firming of the energy group of indices, and strengthening of REITs and banks since last week.  So all is not glum.

Still, the November SP500 Index (SPY, SPX) high remains the market’s sticking point as shown explicitly in this week’s chart:

Market Timing Charts for Sunday’s Issue are Here (opens separate window so you can access all the charts at once)

What about sentiment this week?  I posted the brief summary on my AAII page this week here:

http://www.sunandstorminvesting.com/aaii-survey-review-investor-sentiment.html

Please read my conclusion at the end of this report though too.

What about interest rates? Are they supportive of stocks?  “Yes for now” is the best answer.  The stock market does not need rate competition from Treasuries, so it’s best if rates stay below the lid of around 1.85% shown on the chart (see Bonus Chart of the Week chart link via the link above).

My prediction that the lid would hold was correct.

And what of gold?  With all the central banks running their currency printing presses at full steam, even the Japanese doing so in the latest leadership shift, gold should be rallying right?  Yes, over the long term it should, but for the short term there is less in the way of Euro panic, so less money goes into gold and more shifts out into Euros.  And other than the fiscal cliff, the U.S. economy seemed to be doing better which means more competition for gold too.  However, I do not believe that the long term picture for gold has changed YET.  What will change it is an increase in real interest rates that is significant and that should not happen if the 10 year Treasury stays below that 1.85% cap.  Above there and trouble could be brewing.

At the moment gold is trending lower as shown on the chart (see link above for all charts).  The GLD ETF could return to the summer 2012 lows prior to rallying.

What’s my conclusion about US Stocks for the week?  Before the early November high was breached on Friday, I felt the weekly chart was supportive of a rally.  Now the market can turn down as easily as up.  Why?  Because of the weekly close below that important November high.  Despite that negative point, the weekly chart looks a lot like what happened in the summer.  There was a lot of volatility up and down back then too, but the market went a lot higher before correcting.  I’d give the edge to that scenario which is Bullish in the face of uncertainty!  The Dow Transports seem to agree with me, finally taking out the prior series of daily highs.

This SP500 WEEKLY chart is available here:

SP500 Index Weekly Chart at 12-21-2012 Close  Thanks go to Worden Brothers® for the charting software.  (See my resources page on the main site for details)

Hope everyone has a great holiday week.  We’ll survive the cliff as we’ve survived the Mayan calendar.  ; )

Standard Disclaimer: It’s your money and your decision as to how to invest it.

The above is the text from this week’s free report.  To receive future reports ahead of publication of the text shown above AND much more market timing information, please subscribe for free here:

Free Subscription to My Weekly Newsletter

If you “liked” this post, would you please “Like” it at the “Share” arrow below?  Thanks very much!

And to follow my Buys and Sells and up to the minute insights, please follow and bookmark my Twitter feed here: Join Me on Twitter

Copyright © 2012  By Wall Street Sun and Storm Report, LLC All rights reserved.

Posted in fiscal cliff, gold, gold etf, investment, investor sentiment, Market timing, S&P 500 Index, trading, volatility index | Tagged , , , , , , , , , | Leave a comment

Market Timing Brief for 12-14-2012: Why the U.S. Markets are Vulnerable Now

A Market Timing Report based on the 12-14-2012 Close published Sunday December 16th, 2012

UPDATE 12-19-2012: Two charts explain why the QQQ (NASDAQ 100 “Big Tech” index is now a trading buy and probably also an intermediate term buy (see the two Twitter links to right side of page please to view the charts.  If you do not see them, go directly to my Twitter page to open them immediately (click the link at the bottom of the page).

UPDATE 12-17-2012: What a difference a day makes along with a few suggestive positive comments by two politicians.  Comments by President Obama and Speaker Boehner were enough to move the SP500 Index (SPX,SPY) back up toward that early November high of 1434.27, now about 4 points away.  If we move quickly up to that level or the December high of 1438.59, the market may decide it has taken enough risk on until a deal shows up in the flesh. 

It appears that the market is starting to build momentum ahead of a deal.  The trouble for the Bulls may be that a “sell the news” mentality develops along with more selling before the higher tax rates kick in next year, so it may be best to average up as we go higher and protect profits.  Here is where the market ended the day:

sp500-index-market-timing-chart-2012-12-17-close

November high is the first target and it is just overhead.

And now this week’s issue out on Sunday….

The markets are teetering.  Well, U.S. markets are.  I told you to favor emerging markets last week, and the world continued to drive up their prices.  The emerging markets and the European market are holding their breakouts still, which is impressive.  Chinese economic activity is on an upswing again.  The Chinese know how to goose their markets too.  When Europe is being taken as a better bet than the US markets, you know there is some sort of serious trouble!  Luckily I scaled out slowly last week from the European markets while exiting a number of U.S. ETF’s.  (I am maintaining some core holdings like Berkshire Hathaway that I bought at around $68/share during the 2011 summer swoon, but I’m out of all the U.S. ETF’s.  UPDATE 12-17-2012 Close: Back in small cap growth (IWO, RUO) and mid to large cap growth (IWF, RLG) on 12-17-2012.  Will add back other positions after further progress as indicated.  See my tweets for more details.) 

Remember that the world’s other markets will likely pull back if the U.S. selling gets out of hand, but they’ll hold up relatively better. 

Before I get to the numbers, it is critical to realize which numbers we need to look at and why.  As some of your know now, the numbers on most charts are not corrected for dividends, so if you look at an ETF, the older data misrepresents the actual value of the ETF vs. today’s price.  The current price is corrected for the dividend because the market price drops on the ex-dividend date fairly consistently unless there is other news that prevails, but the old prices on most charts are NOT corrected for the subsequent dividend distribution.

One place to find such dividend corrected data is on Yahoo’s historical data pages.  Some charting systems do the correction and others do not.  For example, the VWO dividend corrected high on 9-14-2012 was 43.15 not the 43.69 shown on many charting systems.  We are still above that high, so the breakout is intact as shown on the chart:

Emerging Markets Chart (VWO): See the Bonus Chart of the Week here: Market Timing Charts for Sunday’s Issue are Here (opens separate window so you can access all the charts at once)

On the other hand the SP500 Index is back below the 50 day moving average, having failed to rise above the November high and stay there last Wednesday.   The VIX has made a higher low and moved up on Friday, so it’s poised for a further rally (which means a SP500 sell-off).

It was all about the Federal Reserve on Wednesday.  Some said that the reason the markets reacted negatively rather than positively to the statement was because the actions they took were already baked into the price.  It was thought that they’d not only continue with the mortgage backed securities buying to inflate the housing market, but also buy more Treasuries when the current program expires, and they indeed included both in their statement.  That means $45 billion for the repurchase of Treasuries, so they can extend the average holding period for the Treasuries they own on the Fed balance sheet as well as the $40 billion they are spending on rebuying mortgage-backed securities (packaged mortgages sold by the lenders).  That is an $85 billion monthly bill!

There is more and more talk of the potential unintended consequences of the Fed magic show.  The only reason we can do this while other nations like Greece suffer is because our currency has the number one reserve status in the world.  The great twist of fate would be that we lose the US dollar’s reserve status BECAUSE of these sorts of antics.  We cannot fake our value as a reserve currency country except for brief periods of time.  Inertia of the financial system protects us to some extent, but not forever.  Even Chairman Bernanke spoke about how the actions the Fed is taking have no historic precedent, so we’re doing a science experiment on the world’s economy.  History teaches us that you cannot create wealth through deception.  Is the Fed no better than Bernie Madoff’s company that worked its accounting magic on depositors’ money?  I’ll leave that to you and history to decide.  I say it won’t end happily for investors who fall asleep on their assets.

Remain conscious and follow the charts, not what “they say,” and you’ll do much better than your bond buying lemming neighbors who have been hypnotized by the Chairman.  Paraphrased but fully accurate in content: “You are better off even though you are being paid no interest, because your house is becoming inflated in value and so are your stocks.”  He actually said that at one of the recent Fed question and answer sessions.  He admitted the Fed is a thief that is stealing from the responsible to save the irresponsible.  Meanwhile, all that money that is not being paid to us in interest is going into the banks’ pockets.

The other action the Fed took is to get rid of all the “dates.”  They will no longer refer to target dates when discussing when the Fed funds rate will go up or when Treasury buying programs will stop and instead will point to guidelines like an unemployment rate below 6.5% and inflation above 2.5% to guide them.  These are not “automatic” in the sense that the Fed. Reserves the right to ignore those trigger points.  So they have no system is what they are saying.  Remember Fed history is bound to be repeated.  Alan Greenspan was notoriously too loose with the money supply, which led to the housing mortgage crisis in the first place.

So getting back to the markets themselves, the SP500 Index is tipping down back below the 50 day moving average and may drag European and Emerging Markets with it as show on the chart (see link above for all the charts).

What would be the easiest and most powerful resolution for the Bulls?  It would be the completion of a reverse head and shoulders formation which is simply an upside down head, the 11-16 low, and two upside down shoulders, which would be the 10-26 low and a new low now to match it, yet to be formed.  The low on 12-05 which was 1398.23 would be an alternative low during the pullback.  The positive resolution of this inverse head and shoulders, if it forms, would be for the SP500 to close above 1438.59.   That move would propel the market back to 1531 or so, still below the 2007 high which was 1576.09.

The issue is that we’d need robust economic growth as well as fiscal responsibility to get us there.  The reason that the stock market could drop severely on resolution of the fiscal cliff is that if the cutbacks in government spending are too severe, GDP will fall due to the drop in such spending, which has supported tech companies throughout this crisis – until now!  So fiscal responsibility can quickly become fiscal poison for the economy.

Gold (GLD) has bounced but needs to hold the most recent daily low as shown on the chart (see link above for access to charts).

Silver (SLV) looks weaker than gold at the moment, because it has yet to drop to the Nov. 2nd low, although it is still ahead of gold (GLD), since the election.

A side note: my call on municipal bonds (e.g., see PZA) this week (to sell) was correct.  The profit taking has deepened.  I wonder if big players know that municipal bonds won’t be touched in the agreement that has not yet been reached!  I bet that is the case.  The cities can’t afford having Washington mess with their money supply.

Investor sentiment would predict based on similar patterns back in August 2012 that we’ll move down slightly to that 1398-1403 level and then rally, perhaps fulfilling the target of the reverse head and shoulders formation.  The AAII survey Bulls rose from 42.22% to 43.23% and the AAII Bears fell from 34.60% to 30.08% and the spread moved up from 7.6% to 13.2% this week.

In conclusion, look for a pullback to the 1400ish level for the SP500 Index.  If you see the market supported there, it could be a very good holiday season for the Bulls.  If that level breaks, watch out below.

Standard Disclaimer: It’s your money and your decision as to how to invest it.

The above is the text from this week’s free report.  To receive future reports ahead of publication of the text shown above AND much more market timing information, please subscribe for free here:

Free Subscription to My Weekly Newsletter

If you “liked” this post, would you please “Like” it at the “Share” arrow below?  Thanks very much!

And to follow my Buys and Sells and up to the minute insights, please follow and bookmark my Twitter feed here: Join Me on Twitter

Copyright © 2012  By Wall Street Sun and Storm Report, LLC All rights reserved.

Posted in emerging markets, gold, gold etf, investment, investor sentiment, Market timing, S&P 500 Index, trading, US Dollar Index, volatility index | Tagged , , , , , , , , , | Leave a comment

Market Timing Tip: There’s Gold in the Gold Miner vs. Gold Chart

There is true gold to be found in the chart below.  If you look at the market timing rally in gold stocks last summer that began on August 6th, you’ll see that the miners (GDX) ran ahead of the gold ETF (GLD).  This is an important observation for this mornings trade, as I’m facing along with you the swoon in gold and gold miners since the Fed announcement.  It occurred in the post-NY market overseas.  Silver also took a dive.

So what’s the gold in the chart below?  The gold comes from seeing that the gold miners are not down as much as they normally would be when gold dives one percent.  Normally the reaction of the miners an easy double or more of the gold move.  But the miners are down only 1.57% in the premarket and are sitting up above the 5 day moving average, which is 46.80 this morning and the trade is at 46.85.  Admittedly the number of shares is low, so we’ll get the real verdict at 9:30 am.

gdx-and-gld-gold-etf-market-timing-chart-2012-8-rally

There’s gold in this chart (see text).

CONCLUSION: I believe at this time that the fact that the gold miners are not sitting back down at the 12-05-2012 low with gold and silver in the premarket is POSITIVE for both gold and silver.  We’ll get the answer today! (UPDATE @ 9:23 am – GDX slipped a bit more just after I published this, but is still ahead of GLD on the chart.  GLD slipped even more though to -1.22% from -0.99%.)

Standard Disclaimer: It’s your money and your decision as to how to invest it.

Free Subscription to My Weekly Market Timing Newsletter

One more thing.  If you “liked” this post, would you please “Like” it at the “Share” arrow below?  Thank you.

And to follow my Buys and Sells and up to the minute insights, please follow and bookmark my Twitter feed here: Join Me on Twitter

Copyright © 2012  By Wall Street Sun and Storm Report, LLC All rights reserved.

Posted in gold, gold etf, gold stocks, Market timing, mining stocks | Tagged , , , , | Leave a comment

Market Timing Brief for 12-07-2012: Emerging Markets Power Ahead

A Market Timing Report based on the 12-07-2012 Close published Sunday December 9th, 2012

UPDATE 12-11-2012 @ 9:41 am: We’ll get back to the emerging markets below.  For now, take a look at the US dollar vs. the metals to see what’s done best since the election.  I plotted the US dollar index (UUP) against GLD (orange line) and SLV (yellow line).  Silver has done the best.  Interestingly I think there is a shift toward “Euro Confidence” which may be more of a lack of confidence in the U.S. until we get our fiscal house in order.  The Euro is up strongly today with the dollar and the metals down. 

us-dollar-index-chart-vs-slv-gld-2012-12-11-940am

Silver has been the winner since the election.

Stocks are up as well even in the US, so the so called risk trade is on.

EWG (Germany) is close to making a new major monthly high today.  I’ll let you know via Twitter today when I pull the trigger on that trade.  Note that there is risk on the first two or so days after a breakout, so be willing to exit if the breakout fails.  NOTE: Added at 10:01 am as I said on Twitter.

UPDATE 12-10-2012: GLD has now formed a bottom as shown in the most current chart below.  You can compare that to the chart at the link below.  Short of Euro panic resuming, the US dollar will have to weaken from here to support a further gold rally.  That it will do so is not entirely clear as the US dollar index just made a higher daily low (see chart below gold chart).  So if you buy GLD here, consider using a stop!

gld-gold-etf-market-timing-chart-2012-12-10-close

The GLD ETF is bouncing from an important low.

us-dollar-index-chart-2012-12-10-close

US Dollar Index needs to fall to support the gold
rally unless Europe panics again.

Now for this week’s issue (with added comments on the emerging markets w/ chart):

Since the election, the Emerging Markets (VWO, EEM) are leading both US Small Caps (RUT) as well as US Large Caps (SP50o Index) as the chart shows:

vwo-emerging-markets-etf-vs-sp500-index-russell-2000-index-chart-2012-12-11-243pm

Emerging markets lead as shown.

The loose money in China, Japan, and the US among other countries is fueling the emerging markets.  China’s economy is responding.  Even Japan’s stock market is breathing in new life, and we’re now 100% invested in our Pacific Rim holdings.

The Russell 2000 Index (RUT, IWM) is close behind, but as of 12-07-2012 is pausing just above the 50 day moving average as shown in this week’s Bonus Chart of the Week (see link below for all charts).

Market Timing Charts for Sunday’s Issue are Here (opens separate window so you can access all the charts at once)

Not coincidentally, the SP500 Index (SPX,SPY) chart shows that we’re now just barely above the 50 day moving average.  So the large caps are pretty much in step with the small caps in market timing terms, while lagging a bit in overall gains since the election.  There is resistance just above here at 1423.73 and then at the Nov. high as shown on this weeks SP500Tracker™ Chart (see link above for chart).

You’ll have to be pretty nimble to capture gains between those two points, so the next easier buy would be above the early Nov. high of 1434.27, while still using a stop.   If the market goes straight up to there, it is more likely to fail than succeed there at this time.

The VIX was falling a bit on Friday, which is bullish, but it must drop below the August through October lows to allow a brand new recent high in the market to occur.  I would guess that it may hit the Oct. or Nov. high prior to that given the political stalemate in DC.

What about investor sentiment?  The AAII survey states that the Bulls rose from 40.93% to 42.22% and Bears barely rose from 34.36% to 34.60% and the spread moved up minimally to 7.6% from +6.0% since last week.  This once again, makes some level of retest more likely.

And metals?  Gold (GLD) has bounced from a higher low, which is positive, as shown on this week’s GLDTracker™ Chart (see link above for all charts).

If you are underexposed to metals, this is an averaging in point.  You can use a stop in case the current base does not hold.  The dollar rally remains an issue for gold as mentioned above.  Only if full Euro panic takes hold will you see gold and the dollar rallying together strongly.

Answering “Mail”: A Twitter follower of mine asked in regard to the pullback in GLD: “Is this due to Blackrock saying miners need better reporting, FCX buying another co. and GS saying Gold going lower?”  I replied that the way price moves is to mirror the sum total consciousness (thinking) of the market around the given stock/ETF/commodity/currency.  The equation is incredibly complex, so decision making must in the end be intuitively based.  Intuitive decision making will bring you to more correct answers.

Incidentally, I teach a method of raising investor decision making consciousness in a one-on-one format.  If you are interested, please contact me for a free strategy session to see if my course would be a good fit for you.

The summary this week is that many markets are at perfect places to fail.  At the same time, some markets, like emerging markets, continue to be favored and are making new highs above key resistance levels.  The Bulls have not lost the ball yet, but without key decision making in Washington, D.C., their days are likely numbered.  The pullback may not be severe, because the backdrop is an improving U.S. economy, albeit slowly!

Standard Disclaimer: It’s your money and your decision as to how to invest it.

The above is the text from this week’s free report.  To receive future reports ahead of publication of the text shown above AND much more market timing information, please subscribe for free here:

Free Subscription to My Weekly Newsletter

If you “liked” this post, would you please “Like” it at the “Share” arrow below?  Thanks very much!

And to follow my Buys and Sells and up to the minute insights, please follow and bookmark my Twitter feed here: Join Me on Twitter

Copyright © 2012  By Wall Street Sun and Storm Report, LLC All rights reserved.

Posted in gold, gold etf, investment, investor sentiment, Market timing, S&P 500 Index, small cap stocks, trading, US Dollar Index, volatility index | Tagged , , , , , , , , , | Leave a comment

Market Timing Brief for 11-30-2012: Retop or Retest?

A Market Timing Report based on the 11-30-2012 Close published Sunday December 2nd, 2012

UPDATE 12-07-2012 @ 10:18 am:  Gold Update (GLD):  Some progress seen in chart below above recent low.  Note the current price vs. the white down trend line.

gld-gold-etf-market-timing-chart-2012-12-07-1017am

Gold is finding some support now and rising a bit. Positive.

UPDATE 12-05-2012: The SP500 Index is holding above the 10-26-2012 low of 1403.28 (just slipped below as I was completing this now at 1401.17).  Below there, and we can easily drop to 1385-1386 and need a successful retest there of the low there on 11-28-2012.  The GLD gold ETF is weak again today and now needs to hold the 11-02-2012 low.  The failure to rally yesterday on US dollar weakness was negative as discussed.  The dollar index is barely up today (UUP up only 0.15%) and GLD is down 0.45%.  Not what we were expecting and it may as suggested yesterday (see below), be due to the feeling that Europe is in much better shape, so the Euro looks a bit better vs. gold.

UPDATE 12-04-2012 Pre-Open on Gold (GLD ETF) below in blue.

UPDATE after Close on 12-03-2012: The SP500 failed two points above my initial upside target today.  That was a good place to lighten up; however, as long as the top line holds on the chart below, which represents the low last Thursday, 11-29/2012, the Bulls still have a chance to exceed that target.

sp500-index-market-timing-chart-2012-12-03-close

SP500 Index must hold the low from 11-29 or there’s more of a correction ahead.

We indeed did rally up to resistance and for some indices we’ve gone beyond resistance at least a bit.   For example, take the small caps we had been following on the way down.  The Russell 2000 Index (RUT, IWM) has continued to bounce from the recent swoon when it dropped to the red line of support shown.

Market Timing Chart Links for Sunday’s Issue are Here

Now if you look at the SP500 Index chart, you’ll see that it is lagging the small caps technically (see above link for chart).

There is a bit more upside possible to the 50 day moving average and if we get through there definitively, the November high would be the next target and then a re-topping of the index.  My take is that without a resolution of the issues in Washington, we won’t get past the November high and could stop here or at the 50 day moving average.  That the small caps are leading is positive as it is harder for large investors to escape from small caps than it is from large caps.

Also on the Bulls’ side is the fact that the overall trajectory of the economy is not as bleak as the ECRI (Economic Cycle Research Institute) predicted.  They have had their stellar record stained by the prediction of a recession that was supposed to start months ago.  Eventually they will be right, but it does not count, because by their rules, their prediction of a recession was wrong.  A recession ALWAYS eventually comes, as this is the nature of the business cycle.  This is much like the record of the big fund managers who suddenly underperform the market for years.  Consciousness comes and goes even for the best of them.  That is why we ultimately turn back to the charts, because the charts show you what is ACTUALLY happening in the markets NOW, not what someone thinks is happening.

So what is the value of market timing this week?  It is to know that this would not be a good buying point to add to your SP500 positions as one example.  Why buy more just below a major signaling point that could turn the market down?  Why not wait for confirmation?

The VIX volatility index is pointed UP having held support this past week.  The bump up on Friday was on a day that the SP500 Index (SPY,SPX) barely moved, which is negative.  It means that investors are seeking more protection from a decline.

Gold (GLD) made some significant progress, and then gave it all back and is resting on support, which must hold or the Nov. low comes into play.  This is shown on the chart (see above link for chart).

The problem for gold is that the US dollar index (UUP, USDX) could break either way.  It has held on within a tight consolidation band that is now 5 days old.  Gold and stocks are very likely to run counter to the US dollar index, so keep an eye on it.

pre-open, 9:11 am, 12-04-2012: Gold did not hold the support shown at the link in the text of this week’s issue shown below.  It now has support at the 11-02-2012 low.  This behavior is interesting considering the fact that the US dollar is very weak.  Yesterday’s failure to respond to that dollar weakness was a clue perhaps to today’s weakness.  Is it the abatement of the Euro panic and unwinding of gold positions that were being used as protection?  I doubt it is that simple as Europe is still a big question mark going forward, but for now the world is seeing the Euro appreciate, so gold becomes less attractive short term.  Gold is certainly not a buy here. (see additional note below)

****ADDED @ 9:39 am: I would wait until it does a reversal back above prior support or if it hits the recent major low, it could also be bought with a stop.   The chart looks similar to that of 6-21-2012.  Gold did drift a bit lower but held above the major low of May.  So a bounce from around this level or slightly below is certainly possible.  Use a stop and average UP rather than down is my opinion.

Where is investor sentiment this week?  The AAII says Bulls rose from 35.8% to 40.93% and Bears fell from 40.80% to 34.36% and the spread shot up to +6.0% from -5.0% last week.  The last similar pair of numbers was seen on 8-04-2011.  That decline led to multiple retests of the initial low including a washout retest of the lows in October.

This improvement in investor sentiment seems too fast and would tend to support that a retest is still going to happen.  If you see the VIX spike with the US dollar up, stocks will be headed to that retest.  If the opposite happens, a full retest of the prior market highs is very likely.

Standard Disclaimer: It’s your money and your decision as to how to invest it.

To receive future reports ahead of publication, please subscribe for free here:

Free Subscription to My Weekly Newsletter

Copyright © 2012  By Wall Street Sun and Storm Report, LLC All rights reserved.

Posted in gold, gold etf, investment, investor sentiment, Market timing, S&P 500 Index, small cap stocks, trading, US Dollar Index, volatility index | Tagged , , , , , , , , , , , | Leave a comment

Market Timing Brief for 11-23-2012: Rallying to Where?

A Market Timing Report based on the 11-23-2012 Close published Sunday November 25th, 2012

UPDATE 11-28-2012: The SP500 Index tested BELOW the white down trend line in the chart below just a few minutes ago and is now back above it.  That is bullish for now, but the US dollar index is rallying again, pressuring gold, and I believe we are still due for a lower retest than this initial downdraft. 

The VIX has popped up (volatility index) and there are several more days of rally left in it, so the SP500 Index should see additional pressure.  Buyers are coming in quickly as they believe that the fiscal cliff is a temporary thing and for this reason expect that the market swoons are temporary.

sp500-index-market-timing-chart-2012-11-28-1040AM

Successful retest (so far) of white down trend line, but more tests are likely (see text above and below)

UPDATE 11-27-2012 10:45 AM: The chart below explains it all.  If we survive this retest of the top red line, 1426ish is still in the cards prior to the next pullback.  Watch the white down trend line too.  A breach back below there will bring us to 1371-1373.

sp500-index-market-timing-chart-2012-11-27-1045AM

We either survive this retest and move to 1425 before the next correction or move down to around 1371-1373.

The good news for the Bulls is that the SP500 Index (SPX, SPY) may make it back up to the 50 day moving average now around 1426ish, but the bad news is that if it makes it there very quickly, it is likely to fail there and come back down hard.  It’s a bit of the “too much too fast” with no good reason scenario that has been playing out.  The market seems a bit deluded about the near term future, but is wildly ready to celebrate a deal in Washington before it has been consummated.  For this reason, I’ve begun scaling out on Friday, perhaps a day or two early.  You see, these big downdrafts rarely end so neatly.  They demand retests of the lows.  A fall to at least somewhere down near where we recently hit bottom may do.  Even a fall to 1370-1371 could suffice.

Have a look at the chart:

http://www.sunandstorminvesting.com/sp500-index-sp500tracker.html

As for the small caps we’ve been following on the way down, the Russell 2000 Index (RUT, IWM) has bounced from the support I identified last week as shown:

http://www.sunandstorminvesting.com/

There is overhead resistance, but it’s moving on the coat tails of the SP500 Index, which has been stronger.  Small caps are harder to escape in a hurry than is the case with the large caps, so they tend to trail the large caps in these bounces that occur in down trends.

Gold has finally made some significant progress.  It came suddenly on Friday with the GLD ETF blasted up through two resistance levels shown in the chart:

http://www.sunandstorminvesting.com/gld-etf-gold-market-timing.html

Where is individual investor sentiment this week?  The AAII survey says bulls rose from 28.82% to 35.8% and the Bears fell from 48.82% to 40.80% and the spread shot up to -5.0% from -20.0% last week.  The last similar pair of numbers was seen on 5-17-2012 and 5-24-2012.  What happened next was that a lower low resulted.  This is another reason to suspect that this overexuberant bounce will be given up.

The VIX volatility index has at most a couple of days to fall before it revisits the lows of the prior 3 months.  Then the selling should resume.  That might fit with an SP500 Index retop at 1425.

Add it all up and the market looks poised to retest lower, even if there are a couple more days of rallying left in the beast.  The buys in the table this week are “trading buys,” meaning that if you are buying now, you are likely buying late in this move unless all the stars now miraculously align across the world’s economies and the world’s debts are absolved from on high.

Standard Disclaimer: It’s your money and your decision as to how to invest it.

To receive future reports ahead of publication AND much more market timing information, please subscribe for free here:

Free Subscription to My Weekly Newsletter

By the way, if you “liked” this post, please “Like” it below.

Join Me on Twitter

Copyright © 2012  By Wall Street Sun and Storm Report, LLC All rights reserved.

Posted in gold, gold etf, investment, investor sentiment, Market timing, S&P 500 Index, small cap stocks, trading, volatility index | Tagged , , , , , , , , , , , | Leave a comment

Market Timing Brief for 11-16-2012: Happy Thanksgiving Rally?

A Market Timing Report based on the 11-16-2012 Close published Sunday November 18th, 2012

UPDATE for 11-22-2012 based on 11-21-2012 Close:  We either go down to retest at 1370ish or lower or have one more push up to 1400-1425 and then another serious corrective move.

sp500-index-market-timing-chart-2012-11-21-close

Pivot Point with Two Ways to Go: 1400-1425 vs. down to retest at 1370ish at least. (Click Chart to Enlarge)

I want to start out with something we can be thankful for, especially if the environment is respected as we use her resources.  It is now said that the US will be energy independent by 2017 given the rate of expansion in our country’s oil and gas resources.  I always predicted that the Saudis plan to control the oil supply would hurt them eventually.  One day without real investment in productive and creative activities, they would be stuck in a sandbox of their own making.  It will be a rude awakening for them when the oil cartel becomes irrelevant.

This price break on energy will be needed considering the mounds of debt this country is building up and the unfulfilled obligations that are now coming due in the way of baby boomer entitlements.  We are already up that well know and aptly named “creek” and simply have the advantage over Greece of having the US dollar as the top reserve currency and not the Greek drachma.

This stock market correction will lead to another rally.  That’s a “duh,” but the question is whether we ascend from here or from the prior summer lows or worse.  Given the fact that we do not yet seem to be headed into a recession on an immediate basis, despite the slowdown, it’s likely that this fall will be contained at least by the 2012 summer lows.  The caveat is that some are still predicting a recession.

On a technical basis, it’s a fool’s game to predict where the market will go once we are “in the middle” of a fall as we are now.  The only market reaching last summer’s support is the tech market, so one could start buying there with a stop and a willingness to get back in if the market triggers your stop and then recovers.  It’s simple, but not easy and not risk free.  You have to be willing to give up a little to make a lot in the market.  There is no way around that old adage.

As for the small caps we’ve been following on the way down, the Russell 2000 Index (RUT, IWM): http://www.sunandstorminvesting.com/ has been hit hard.  Although it’s on a slight bit of support, there is room below as discussed at the link.

The SP500 Index (SPX,SPY) is attempting to find support once again, but despite any bounce, there is significant risk for a further fall as shown by the chart:

http://www.sunandstorminvesting.com/sp500-index-sp500tracker.html

Gold (GLD) is in the process of attempting to find a bottom.  The type of bottom is discussed in detail here, along with some insights on the best time to buy into an unpopular market and when to exit a popular one:

http://www.sunandstorminvesting.com/gld-etf-gold-market-timing.html

When the GLD ETF it reaches that point (the shoulder discussed), it will be a buy with a stop.

There is one interesting buy that popped up this past week based on Japanese monetary policy (see Pac Rim ETF in free report)

Where is individual investor sentiment this week?  The AAII says bulls fell back to 28.82% from 38.50% and the Bears rose to 48.82% from 39.91% and the spread shot down to -20.0% from -1.4% last week.  Last week I told you we were still in “danger.”  This week, the -20% spread allows for a bounce for the first time in a while.  That said, I can give you this bit of valuable insight.  When there has been this much damage to the markets, the lows that are established are often retested.  V bottoms are uncommon unless there has been massive damage to the markets as in March 2009.  So be prepared to trade this next bounce whether it takes off from the current level or from the 2012 summer lows.  And be prepared to take your gain and wait for the next test of the current or even lower lows.

Have a great week giving Thanks for all that you have in life!

Standard Disclaimer: It’s your money and your decision as to how to invest it.

The above is the text from this week’s free report.  To receive future reports ahead of publication AND much more market timing information, please subscribe for free here:

Free Subscription to My Weekly Newsletter

By the way, if you “liked” this post, please “Like” it at the “Share” arrow below and/or re-Tweet it below.

And to follow my Buys and Sells and up to the minute insights, please follow and bookmark my Twitter feed here: Join Me on Twitter

Copyright © 2012  By Wall Street Sun and Storm Report, LLC All rights reserved.

Posted in gold, gold etf, investment, investor sentiment, Market timing, S&P 500 Index, small cap stocks, trading | Tagged , , , , , , , , , | Leave a comment