Market Timing Brief™ for Bitcoin 2-03-2018 (2-07-2018 Update): Bitcoin On the Line (update) and How to Risk Manage Your Cryptocurrency Holdings.

A Market Timing Report based published Saturday, February 3rd, 2018

I deliver focused comments on market timing once or twice a week.  These are supplemented with daily “Tweets/StockTwits” (see links below).  If you are not interested in Bitcoin, please see the prior post and scroll through the Bitcoin charts to the SP500 section HERE. Thank you.

Bitcoin Update 2-04-2018 at 8:11 pm : Bitcoin is right on the edge.  It must hold this level or it will drop to about that horizontal line at about 5321.  Look over the prior comments to understand what the implication of the market timing wedge is!  Bitcoin is now at the bottom of that wedge.  I believe it’s more likely to AT LEAST form a double bottom or descend to the next level of support and do so, than go straight back up due to the severe technical damage we’ve seen.

Also realize the support line is just the next market timing target, not a definite braking point for a fall.  We’ll have to see what the charts look like when and if Bitcoin reaches the support line to know whether it’s worth a shot.  I do think it’s possible that it could flush out a lot of speculators however.  Stay tuned.

Keep up-to-date during the week at Twitter and StockTwits (links below), where a combined 33,300+ people are joining in…

Follow Me on Twitter®.  Follow Me on StockTwits®.

BTC-bitcoin-market-timing-chart-2018-02-07-752pm

Bitcoin is literally on the line.


Bitcoin Update 2-04-2018 at 12:37 pm : Bitcoin has failed to reverse and stay above the 9025 1-16-2018 market timing low on Bittrex (this low will vary by exchange).  That’s a negative I see today with the price at 12:38 pm ET at 8451 on Bittrex.  The next minor support is 7900, yesterday’s low on Bittrex and then the lower line of the market timing wedge in the chart below which today is at 7854.

Remember that numbers that are based on trendlines will change from one day to the next and prices will vary across exchanges.  Exchange prices are about the same if volatility is low, but when it rises, generally you will see prices varying greatly across exchanges.

Breaking both of those market timing support lines could lead to further significant damage to Bitcoin’s chart/price.  Remember also, however that markets can swoon below obvious support lines, shake out some traders and investors and then zoom back up, so you need to have a trading/investing plan around your cryptocurrency holdings, such as “I’ll take an X% loss, but below there, I am OUT.”

Taking Profits on Speculations After Large Gains

You also need to learn how to take profits on speculations like cryptocurrencies or small or microcap tech companies.  Selling your entire principle after the price has gone up in big way is something I just did with Ripple recently when its price went up to over 14 times my initial investment.  That’s the minimum you should take out of your speculation.  In fact, I took out the principle PLUS 100% profit and will ride the rest of my Ripple unless the story falls apart.  I still have a 100% profit regardless of whether the rest goes to zero.  This is a luxury I realize, but when it happens, don’t fall asleep!  At least take out principle on speculations with huge profits!  If the story keeps improving and the price keeps rising, you may want to wait for the first increase in volatility to take this kind of profit.  Above all, have a plan that works for you.  This is simply one idea about how to manage speculations.

Risk Management of Speculations

Going back to the risk side of the equation, if you have no “get out point,” which should recognize the degree of volatility of cryptocurrencies, you are not a serious investor.  If a coin can vary by 20% in a day, you don’t want to use a 5% stop.  You simply should not invest in it in the first place (or alternatively you should invest far less) if you cannot take a certain level of loss.  Position sizing relative to your entire portfolio is something you must learn about and practice, or you are simply not serious as an investor or trader.  Google it and read Van Tharp’s book (not light reading, but covers the concept well) “Trade Your Way to Financial Freedom.”  Position size properly and protect your principle and large profits with trailing stops (Google it!) and you will be ahead of the majority of “fly by the seat of the pants” investors.

I’ll give you one example of risk assessment and management related to Bitcoin: GBTC, the Bitcoin Investment Trust, which has fallen 66.4% from its all time high of 38.71 and is still 40.5% overvalued vs. the net asset value of the Bitcoin it holds as shown by Morningstar HERE You are paying a huge premium for it, which could go to zero on any single day. 

If you own GBTC (which you shouldn’t in my opinion), and you’re not willing to hold through a decline of about 75% (which may or may not occur from this point on), you should not buy it in the first place.  That number takes into account the inherent volatility of the shares. You should not own ANYTHING with that amount of volatility unless you are willing to lose most or all of your money.  Invest accordingly and please, buy Bitcoin if you want to “own Bitcoin,” don’t buy an ETF/trust that sells at a massive premium to what it owns!

Stay tuned on social media at the links below during the week to stay up to date. Posting here is more time intensive for me and slower, so social media is a key way I can stay connected with you quickly throughout the week.

Follow me on BOTH networks, as each of them sometimes runs into traffic or technical issues.

Be sure to review the charts below to add clarity to the above text….

Bitcoin Update 2-03-2018 at 9:10 am: Bitcoin survived a market timing test of the lower line forming the normally Bullish downward wedge shown in the chart below. Please read the prior post HERE to catch up (3 charts and comments on what can “save Bitcoin”).  The second phase of recovery, if this recovery is in fact real, is the upside reversal above the horizontal line shown in the chart.  These are psychological levels that can trigger buying,  although they are not volatility based levels.  Look at them as checkpoints of technical chart healing.  The next step would be breaking that Bullish market timing wedge to the upside which would cause a major swing UP in my view.  If BTC merely rises to the upper wedge line and fails, the prospects of a real “recovery” would be greatly diminished.   

BTC-bitcoin-market-timing-chart-2018-02-03-906am

BTC is attempting a recovery after a crash or “huge decline” if you prefer.

My new post about the stock market, gold and interest rates will be out by Sunday at the latest.  It’s been a fast paced week!

Be sure to visit the website for more general investing knowledge at:

Sun and Storm Investing™

Standard Disclaimer: It’s your money and your decision as to how to invest it.

I thank Worden Brothers for the charting system I use to post these charts.  If you want to know more about the charting system I use every day, go to my “Other Resources” page here:  Other Resources   It makes it much easier to follow along with me if you can see the charts and manipulate them on your own computer.  It’s a great investment to have an excellent charting system.  Check it out with a free trial at the link above.

Copyright © 2018 By Wall Street Sun and Storm Report, LLC All rights reserved.

Posted in Cryptocurrency, investment, trading | Tagged , , , , , | Leave a comment

Market Timing Brief™ for the 1-26-2018 Close (2-02-2018 Update on Bitcoin): The “Tax Plan Reset.” Up Trend After Reset Continues in Large Caps. Gold Up On Dollar Down, Interest Rates Up.

A Market Timing Report based on the 1-26-2018 Close, published Sunday, January 28th, 2018…

I deliver focused comments on market timing once or twice a week.  These are supplemented with daily “Tweets/StockTwits” (see links below).

NOTE: If you are uninterested in Bitcoin, scroll down past the first three charts…

2-03-2018: Latest Bitcoin Update was published HERE.  From this point on, all Bitcoin updates will appear as separate posts or separate threads of updates on the same post focused on Bitcoin.

2-02-2018 Bitcoin Update: Crash mode, but with some support lines. What can save Bitcoin?

The chart is below, but first, let’s go over what is driving things short term…

#SAUS:

Story: The story with India is definitely a big negative.  The government has banned all transactions with Bitcoin to defend its currency.  After all, why use the rupee if you can use BTC to buy your coffee?  They are NOT yet banning it as a store of wealth, but this definitely decreases the UTILITY of Bitcoin as India is seen as a huge market, and a market that could provide leadership to other nations in restricting transactions.

Access: Bittrex is a popular exchange that has not allowed US dollar trades directly into BTC, but says it will do so now.  Today would be a good time to do it; however, there is no intraday fix for access and this crash is happening now, not next week.

Utility: Big hit on utility as noted in the story section above. What BTC really needs is a big POSITIVE story to counteract the negative India story.

Safety: Tether is in the news as a possible fraud for being tethered to nothing vs. dollars, which was stated by them.  They are being investigated.  This does not impact BTC, Etheruem and other coins.  So safety is not an issue here.  The feeling of safety vs. a crashing BTC is an issue however and could scare a number of new investors off as they “freeze in the lights.”  That impact further reduces demand on the way down.

What we saw in the chart previously was a pullback.  What we have now is a crash with POSSIBLE support points that actually mean little until the market takes note of them and moves up.  Several support lines worked for a day or two and were then broken.  Understand this: Technicals will not likely save BTC.  It will have to be fundamentals in my view especially if the above two lines are broken.  You can always see a bounce to lower highs in a crash, so be careful what you bite on.

Now for the chart…  The up trend line hits at about 7,500.  Below there it’s all guess work.  Right now Coinbase is quoting 7,907 as the price, a bit above there.  Bittrex, which tends to be lower except during these big downdrafts is at 8,377.

You can also see that the down trend channel had support at about 8,000, so those are your final two support numbers.  The upside on a bounce is that upper down trend line which is now at 11,100-11,200 as I view it in the browser.  Price must rise above the top down trend line convincingly and move up for a recovery of the up trend to occur.

The downward wedge formed by the trend lines shown is bullish technically, but not a guarantee.  It means that volatility is FALLING on the way down.  Rising volatility in a down move would suggest a bottomless pit falling back to zero, but a wedge does not; however, no single technical factor is a guarantee, because the trend is still down for now.  Beyond that, you can look at volatility ranges, but those were broken badly last night and provide only a very short term idea of the active price range of trading.  Bottom line?  Decide what you can afford to lose if you are under water and stick to your plan.  No one can tell you what BTC is worth today other than what people are paying for it.

BTC-bitcoin-market-timing-chart-2018-02-02-744am

Support levels have not held.

1-31-2018 Bitcoin Update: Triangle Broken but Holding Support at a Lower Low

That’s not a good thing.  We’re seeing lower highs and lower lows.  Price has broken through the top slanted line, which is the long term trend line for 2017 into 2018.  It has also broken the triangle in the prior chart (below) to the downside.  The only thing left is a couple of support levels around 9000 and 10000.  It must hold one of these to avoid serious further damage. 

Bitcoin could really use a UTILITY boost like the lightening project increasing transaction speed.  Without that, traders will decide the price.  Demand tends to be tentative after a fall like this. The STORY has been under pressure with detractors falling over themselves to say it’s going to zero.

Increased ACCESS at Robinhood (cheap trading site) could help boost demand as they roll out that access to more and more states.  SAFETY will improve with enhanced regulation.  Remember unless you are criminal or a crook who does not pay taxes on gains, you should be happy cryptocurrencies are being regulated, because otherwise, they will be ELIMINATED for all but thieves trading between each other, which will be outside the developed world.  Better to have regulation than lose everything.

Remember my cryptovaluation scheme: #SAUS.  Story, access, utility and safety.

BTC-bitcoin-market-timing-chart-2018-01-31-1104am

Bitcoin has to make a stand.

UPDATE 1-29-2018 Bitcoin Update: Triangulating.

Bitcoin will likely move in the direction of the break of the market timing triangle.  Traders no doubt have an eye on this, as valuing Bitcoin is difficult.  Lately it’s worth from $9,000 -$20,000!  Staying above the horizontal line would be a plus.  Breaking out above the top line of the triangle, better!

BTC-bitcoin-market-timing-chart-2018-01-29-244pm

Triangulating. Follow the direction of the next break, up or down if you are trading.

Back to this week’s issue on the big reset in the markets…

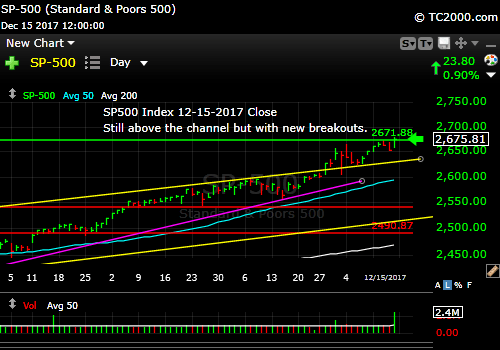
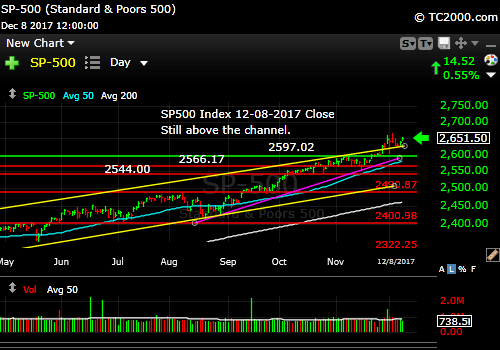
1.  SP500 Index Market Timing: The market has continued higher, despite market timing signals that say it is a stretched.  I’ve explained recently, and I think it’s important to repeat, this is in part due to what I call the “Tax Plan Reset” (#TaxPlanReset on social media). 

Before the Tax Plan bill was passed by the GOP and the President, the market had certain expectations, but after passage, expectations are much higher.  There are provisions in the tax plan that allow capital expenditures to be expensed in the first year rather than depreciating them over multiple years.  This will add fuel to small business creation, which is where the majority of new jobs comes from.  This means more business for the larger businesses serving them and those larger businesses also have the same new tax advantage.  Lower tax rates for many companies (watch out for the losers!), will add fuel to the economy.  We are spending money that should normally be saved against our debts in good times and spending it on growth.  We will have to pay for this later, or rather our children will have to pay.

But for now, this means we can spiral up.  Party on Garth!  (anyone get that reference?)  Remember the tax changes on depreciation make earnings look better in the short term and worse in the longer term, but it is still a boost to business, because capital NOW invested intelligently is worth far more than capital 5 years from now.

The other side of that coin is that businesses overpaying for other businesses with tax break money or repatriated money will be punished for using capital poorly.  Repatriated money only has value if it is used well, which for shareholders means being properly invested or returned to them through increased dividends and buybacks.

There will be new businesses created through the new money available to the U.S. economy, but a good deal of it will enrich shareholders.  This money in turn will be reinvested in the same or different stocks by many and some will be spent, fueling the economy, and driven stocks up in price.

This means we need to be patient in seeing the impact of the Tax Plan unfold, and that the market may go far higher than anyone expected, not just on the optimism investors have, but also on the magnitude of the fiscal stimulus.

The catch?  The catch is that after the degree of optimism we saw among investors just a few weeks ago, there is invariably a correction in the market.  It could be a modest correction (4-8% from closing high to closing low of the dip that follows) or more than modest (over 20%), but in my view it won’t be the end of the run for the Bull.

For anyone new to my thoughts, review this on the upcoming market correction: HERE (under sentiment).

Keep up-to-date during the week at Twitter and StockTwits (links below), where a combined 33,300+ people are joining in…

Follow Me on Twitter®.  Follow Me on StockTwits®.

SP500 Large Cap Index (click chart to enlarge; SPX, SPY):

sp500-index-spx-market-timing-chart-2018-01-26-close

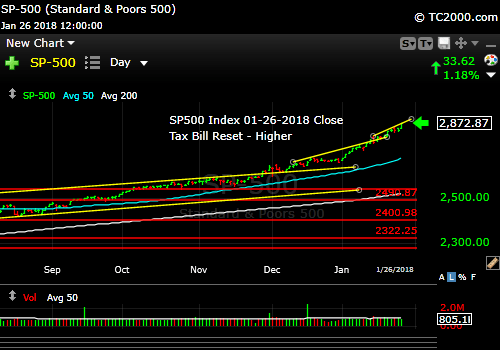
Increased expectations led to the Tax Plan Reset.

Survey Says!  Sentiment of individual investors (AAII.com) showed a Bull minus Bear percentage spread of  +21.42 vs +32.72% last week.   After the extreme Bullishness reported on 1-04-2018, we can expect sentiment to bob up and down at a higher level, before easing.  How much time do we have to the next correction?  If it’s a smaller one after massively high sentiment, as in the three sentiment peaks occurring from 2004-2006, it will be in about 3-23 weeks from 1-03-2018.  That’s simply historical data, not a crystal ball.

If it’s a larger drop as in 2011 (19.4% from closing high to closing low) after peak sentiment, it COULD be 18 weeks from 1-04 as an example.

To summarize, based on the prior experience with these massive sentiment peaks, the lag to correction big or small is from NOW (3 wks from 1-04 is now!) to 20 weeks from now.

These are just examples and the actual timing could be entirely event driven by an event we are not expecting. 

AAII.Com Individual Investor Sentiment Poll
Bulls Neutrals Bears
45.45% 30.52% 24.03%
Thurs. 12 am CT close to poll

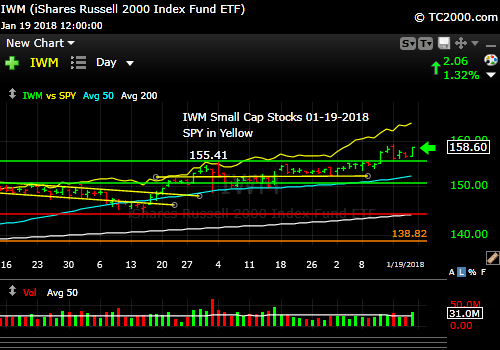
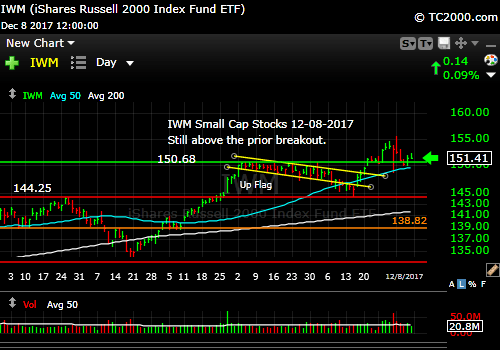
2.  U.S. Small Caps Market Timing:  Small caps under-performed large caps this week as they have since 1-16-2018 (take a look at last week’s comparison chart; link to upper right). This is a sign that investors are trimming their risk appetite, and we’ll need to keep a close eye on it, and do our best to use market timing to protect profits.  It could admittedly simply be a pause to be followed by another move up.  My main exposure to higher risk US stocks is in mid caps as I’ve said.

Russell 2000 U.S. Small Cap Index  (click chart to enlarge; IWM, RUT): Longer term view…

iwm-russell-2000-market-timing-chart-2018-01-26-close

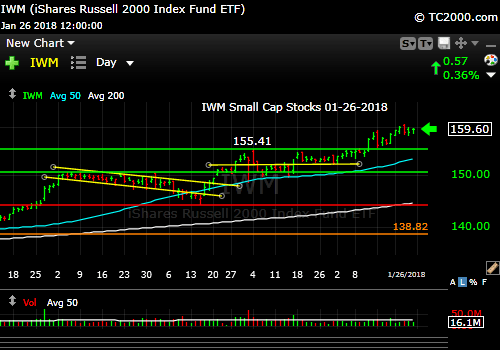
Small caps lag large.

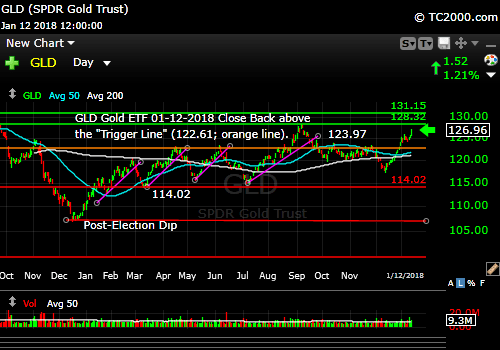
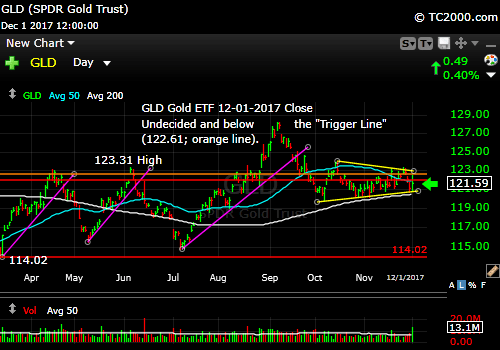
3. Gold Market Timing: Gold is now testing the 2017 high.  The U.S. Dollar trend was your friend in gold this week as the administration tried to back out of comments made by Sec. Mnuchin about the joy of having a weak dollar in the short term (see my social media comments). Watch the dollar this week and protect gold profits in trading positions.  TrumpFlation is here and may sustain the rise in interest rates. See the next section on that. 

Gold ETF (click chart to enlarge the chart; GLD): (CORRECT DATE IS 1-26-2018 Close)

gld-gold-etf-market-timing-chart-2018-01-26-close

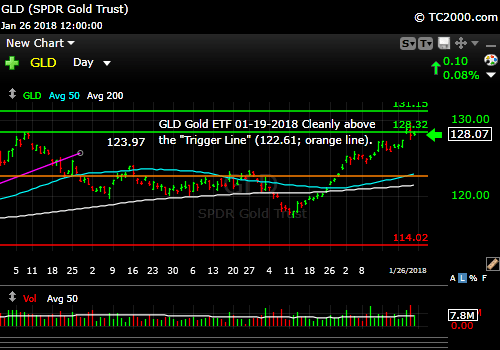
Testing 2017 high. Follow the dollar!

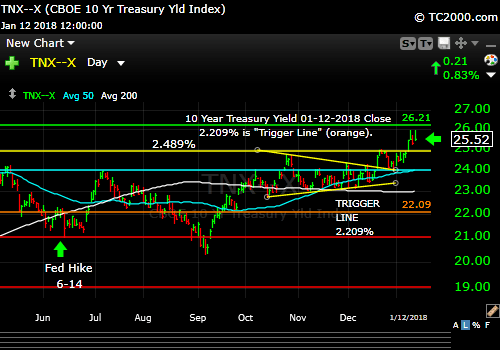
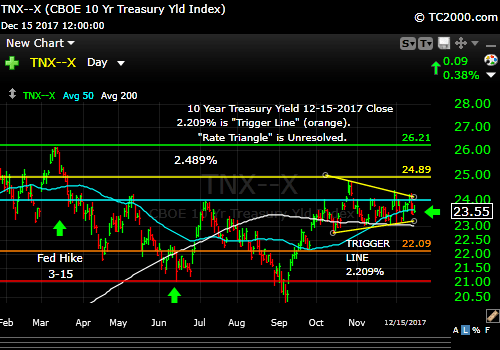
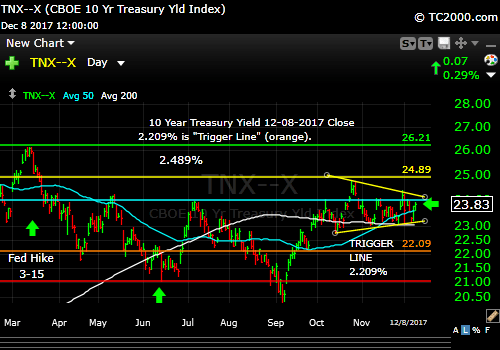
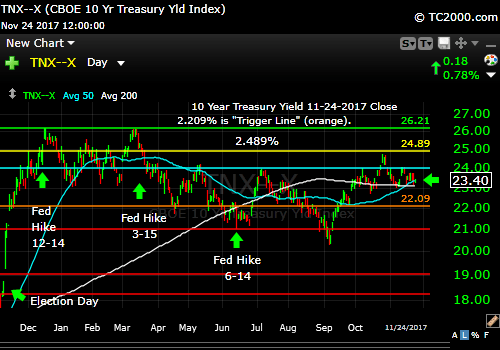
4. Interest Rate Market Timing – U.S. 10 Year Treasury Note Yield (TNX): The 10 Year Yield is currently levitating above the green line shown in the market timing chart below.  It must hold that level and then rally or financials (and perhaps the entire market) will correct at least a bit. If it breaks out again to the upside, we’ll know the TrumpFlation thesis is still intact.

U.S. 10 Year Treasury Note Yield (click chart to enlarge; TNX, IEF, TYX,TLT,TBF):

tnx-10-year-treasury-note-market-timing-chart-2018-01-26-close

Must continue rising to support further financial stock gains and perhaps SPY/SPX gains.

We need to review our three market timing signals (below the Bitcoin comments)…

5. Bitcoin Market Timing:  A quick note.  Bitcoin has been holding above the support I outlined last week.  I hope you’ve adjusted your position size to remain a Bitcoin millionaire if you became one during the rise of Bitcoin.  I brought this up on January 7th just after a big bounce in Bitcoin.  If you haven’t, you really don’t know what you are doing.

If you “have” wealth, you know the rules.  If you “want” wealth, you don’t have any rules and you eventually lose most of, too much of, or all of what you have gained, whether in bitcoin or in risky stocks.  Even Berkshire Hathaway has fallen 50% multiple times from pricey market tops.  “Having wealth” doesn’t mean you need to be a millionaire yet, but you are on your way if that is the state of your consciousness, or “mind” if you prefer.  Even “safe stocks” like GE can become risky.  Or remember Enron?  WorldCom? Follow the guidelines of investing that are meant to prevent greed and large losses, or be prepared for huge disappointments ahead. Learn about position sizing and trailing stop losses and use them.  They can protect any investor from huge market declines.

Now let’s review the three market timing signals together….

MY SIGNAL SUMMARY for a Further U.S. Stock Market Rally with Low Inflation:

Stock Signal GREEN

Staying long for now. 

Note: I’ve changed my criteria for the equity signal for a further U.S. stock market rally to the following: Green = Bullish, Yellow = Neutral, Red = Bearish.  Note that a Bearish signal does not mean we should not buy.  It depends on what is going on in the economy and how oversold the market is at a given point whether the Bearish signal is to be sold, sold on the next bounce, etc.   I will keep showing the prior orange “Trigger lines” in the charts for now as reference points only.

Gold Signal RED

GLD is ABOVE the “Trigger line” which is positive for gold, and usually worse for stocks at least on a relative basis, IF inflation is getting out of hand.  Then it’s gold up (based on negative real rates of return on debt), stocks down (again, eventually that is, if inflation becomes too “hot”). Lately, it’s been dollar down, gold up, and stocks up.  The dollar is playing a role against the backdrop of rising rates.  Down dollar with rising rates and falling bonds, means investors are losing in longer term debt.  Gold looks great compared to that.

Rate Signal GREEN

10 Year Yield ABOVE the “Trigger Line,” good for stocks, not bonds.

Thank you for reading.  Would you please leave your comments below where it says “Leave a Reply”… or ask a question…  Pay it forward too by sending the link to MarketTiming.Blog (that link will immediately connect them to this webpage) to a relative or friend.  Thanks for doing that.

Be sure to visit the website for more general investing knowledge at:

Sun and Storm Investing™

Standard Disclaimer: It’s your money and your decision as to how to invest it.

I thank Worden Brothers for the charting system I use to post these charts.  If you want to know more about the charting system I use every day, go to my “Other Resources” page here:  Other Resources   It makes it much easier to follow along with me if you can see the charts and manipulate them on your own computer.  It’s a great investment to have an excellent charting system.  Check it out with a free trial at the link above.

Copyright © 2018 By Wall Street Sun and Storm Report, LLC All rights reserved.

Posted in Bonds, Consumer Discretionary Stocks, Cryptocurrency, gold, investment, investor sentiment, large cap stocks, S&P 500 Index, small cap stocks, Treasuries | Tagged , , , , , , , , , , , | 2 Comments

Market Timing Brief™ for the 1-19-2018 Close (1-23-2018 Bitcoin Update): Stock Market “Pause” Ahead, but When? Gold Rising on Rising Rates and Falling Dollar: A Prescription for Second Fiddle Currency Status.

A Market Timing Report based on the 1-19-2018 Close, published Sunday, January 21, 2018…

I deliver focused comments on market timing once or twice a week.  These are supplemented with daily “Tweets/StockTwits” (see links below).

UPDATE 1-23-2018: Bitcoin is Holding the Line…Two Lines…

Bitcoin is holding two major market timing support lines after two successful tests below both (see chart below).  Remember, the precise value (even rough value!) of Bitcoin is an unknown, so it will tend to trade technically to an extent. 

Predictions of bitcoin rising to 100,000 are not too helpful to those watching these recent highly volatile swings.  Do not invest anything you cannot afford to lose. Recently central bank/government regulation efforts are popping up around the world as they begin to wake up to the potential of bitcoin to displace their currencies. 

Regulation is therefore DESIRABLE, because without it, all cryptocurrency trading will be banned. Pay your taxes on all transactions (when you buy a house with BTC, that is a taxable event if you have a gain from the time you bought the BTC with US dollars for example and you can declare losses against gains).  The revenue the government gets from cryptocurrency trading will please them and regulation will bring in more investors and drive out the criminal types  and force them to hide under new rocks.

A further decline of BTC below the two market timing lines shown would cause a serious further decline in my view.   This could be triggered by ANY move below the lower of the two recent lows shown in the chart.  And it could happen at 3 am ET.  That is why you must control your risk through proper position sizing.

BTC-bitcoin-market-timing-chart-2018-01-23-1156am

Holding major support lines after two tests below.

Back to this week’s issue, including thoughts on when the first major correction will begin….

1.  SP500 Index Market Timing: Both parties and our President decided to shut the government down this past Friday at 12 midnight.  How much market reaction there is depends on how long it continues.  It does not help to reduce the productivity of the nation, and such a situation was entirely avoidable in the first place.  Government is not getting all that you want.  It’s about compromise, like it or not.  The truth will be told here.  They ALL could have made a deal, as deals are not just what ONE side wants.

The Democrats were asking for a bone on DACA in the funding resolution, and the GOP decided to force them to the table on ALL of immigration to get their DACA deal.  Now President Trump has dug his heels in and says the government must be reopened for him to consider DACA.  And on it goes.  In the end, both sides will have to compromise, the impact of this will be limited and we will move on, so I’m staying invested, but watching stops on profits of as well as principle in all trading positions.

At the moment, we can guess that the markets will not behave horribly on Monday, as there was no deal in sight well before the market closed on Friday.  The S&P500 closed at a brand new closing high on Friday.  The situation must be resolved within a reasonable period of time.  If it is, this will have been just one more blip in a Bull market, one that is likely going to hit pause in the coming months.

When will the “pause” occur?  I favor between now and “go away” time in May.   It’s possible though that the “pause” will be in the summer or fall instead, but regardless, all of the gains going forward will be wiped out, before the Bull market resumes.  That’s my view based on sentiment.

As I’ve told you, I’m concerned about the recent sentiment peak as outlined 2 weeks ago HERE.  More on sentiment, just below the chart…

Keep up-to-date during the week at Twitter and StockTwits (links below), where a combined 33,300+ people are joining in…

Follow Me on Twitter®.  Follow Me on StockTwits®.

SP500 Large Cap Index (click chart to enlarge; SPX, SPY): The new high was not that much higher than the prior four closes, so some deceleration is apparent.

sp500-index-spx-market-timing-chart-2018-01-19-close

Brand new high vs. recent off the wall sentiment.

Survey Says!  Bullish sentiment rose somewhat this week as I expected, given the last extreme.  Sentiment of individual investors (AAII.com) showed a Bull minus Bear percentage spread of  +32.72% vs. +23.60%  last week.  The same sort of pattern occurred back in early 2011 during the ramp up to the final high preceding a large correction/Bear (>20% drop).  This does not mean we’re going to jump out of the market entirely.  We’ll be preserving profits and watching stops on excess exposure though to provide some cash to buy back exposure at lower prices.

AAII.Com Individual Investor Sentiment Poll
Bulls Neutrals Bears
54.11% 24.50% 21.39%
Thurs. 12 am CT close to poll

2.  U.S. Small Caps Market Timing:  Small caps have been underperforming large caps since the November low as seen on the chart.  The rising yellow line is SPY, the S&P500 Index ETF.  Small caps are still ahead since the 2016 election, but the recent lag fits the picture of a market bracing for a drawdown.  It’s harder to get out of small caps as it gets later at the party.  Still, there has been a recent breakout and as long as the gains can be held, small caps can continue to move up.  A reversal below the green line would result in further significant further losses.

Russell 2000 U.S. Small Cap Index  (click chart to enlarge; IWM, RUT): Longer term view…

iwm-russell-2000-etf-vs-spy-market-timing-chart-2018-01-19-close

Small caps have been lagging large caps recently.

3. Gold Market Timing: Gold has been doing well, but now faces resistance levels just overhead, not to mention elevated interest rates which are a bit stretched, though rising.  From the post-election low, GLD has not returned as much as the SP500 (and dividends are not included; SPY is in yellow on the chart below).  Gold typically does poorly in times of economic strength with low inflation.  Since mid-November, gold has been rising with rates, but that slowed a bit last week as rates went up to even higher highs.  As discussed last week, gold can only work in a setting of rising rates if the Federal Reserve falls behind in raising rates ahead of inflation. 

A factor that has been helping gold is the falling dollar.  As the dollar would be expected to rise with rising rates and a robust economy, the fact that it has been falling is of concern.  I believe the crux of this is TrumpFlation concerns.  Trump is no fiscal conservative, and his tax cuts just make the entire fiscal picture worse despite the strength we’ve had in the economy.  To the world, that means trouble for US debt repayment down the line, so rates rise and the dollar falls. 

China is in the beginning stages of a “War on the U.S. Dollar.”  They want the yuan to rule the world.  They are currently making a move on the use of U.S. dollars to settle oil transactions in petrodollars.  If U.S. leadership continues on the current path, the U.S. dollar will take a seat next to the British pound, the currency of a former empire. The dollar will still significant on the world stage, but will play second fiddle to China.  The U.S. needs to wake up now, or it will lose the long game!

Gold ETF (click chart to enlarge the chart; GLD): Gold lagging the SP500 Index (yellow line)…

gld-gold-etf-vs-spy-market-timing-chart-2018-01-19-close

The rise with rates has slowed.

4. Interest Rate Market Timing – U.S. 10 Year Treasury Note Yield (TNX):

There was in fact an impressive move in Treasuries this week.  It led me to max out my exposure to financials once again.  The bond gurus, Bill Gross and Jeff Gundlach (former drummer now billionaire bond investing guru) say the Bear market in bonds is now upon us.  This will mean further rotation of assets from bonds into stocks, which could help fuel the final rise of the markets and lead us to a Bear market.

But don’t despair because you can always find an ultra-Bull somewhere, this time appearing as Tom Lee, who has returned to being highly Bullish, predicting ELEVEN more years of a rising stock market with a wild ranging prediction for the top of 6,000 to 15,000 for the SP500 Index.  This year, his target is 3025.  Or you may find the less sanguine outlook of Morgan Stanley to be more on the mark.  Listen HERE…

I would say that it’s not wrong to look at the big macro picture, but making numerical market predictions beyond the immediate few weeks or quarter is nonsense.

We’ll follow the technical market timing data as well as the fundamentals, and follow good position sizing and manage our exposures, and leave the wild guesses to the overpaid gurus.

U.S. 10 Year Treasury Note Yield (click chart to enlarge; TNX, IEF, TYX,TLT,TBF):

tnx-10-year-treasury-note-market-timing-chart-2018-01-19-close

Rates up with dollar down means trouble.

Now, as usual, we need to review our three market timing signals (below the chart after you review it…)

Let’s review the three market timing signals together….

MY SIGNAL SUMMARY for a Further U.S. Stock Market Rally with Low Inflation:

Stock Signal GREEN

Staying long for now. 

Note: I’ve changed my criteria for the equity signal for a further U.S. stock market rally to the following: Green = Bullish, Yellow = Neutral, Red = Bearish.  Note that a Bearish signal does not mean we should not buy.  It depends on what is going on in the economy and how oversold the market is at a given point whether the Bearish signal is to be sold, sold on the next bounce, etc.   I will keep showing the prior orange line for now as a reference point.

Gold Signal RED

GLD is ABOVE the “Trigger line” which is positive for gold, and usually worse for stocks unless there is inflation moving faster than the Federal Reserve response to it.  Then it’s gold up, stocks down. The dollar is playing a role against the backdrop of rising rates as discussed above!

Rate Signal GREEN

10 Year Yield ABOVE the “Trigger Line,” good for stocks, not bonds.

Thank you for reading.  Would you please leave your comments below where it says “Leave a Reply”… or ask a question…  Pay it forward too by sending the link to MarketTiming.Blog (that link will immediately connect them to this webpage) to a relative or friend.  Thanks for doing that.

Note: My monthly newsletter is now CLOSED to new subscriptions.

Be sure to visit the website for more general investing knowledge at:

Sun and Storm Investing™

Standard Disclaimer: It’s your money and your decision as to how to invest it.

I thank Worden Brothers for the charting system I use to post these charts.  If you want to know more about the charting system I use every day, go to my “Other Resources” page here:  Other Resources   It makes it much easier to follow along with me if you can see the charts and manipulate them on your own computer.  It’s a great investment to have an excellent charting system.  Check it out with a free trial at the link above.

Copyright © 2018 By Wall Street Sun and Storm Report, LLC All rights reserved.

Posted in Bonds, Consumer Discretionary Stocks, Cryptocurrency, gold, investment, investor sentiment, large cap stocks, S&P 500 Index, small cap stocks, Treasuries | Tagged , , , , , , , , , , , , , , , , , | Leave a comment

Market Timing Brief™ for the 1-12-2018 Close (1-17-2018 Bitcoin Update): Trumponomics Being Priced In. SP500 Index Breaking Out Again. Small Caps Keeping Up. How Gold Can Beat Stocks in a World of TrumpFlation.

A Market Timing Report based on the 1-12-2018 Close, published Sunday, January 14th, 2018

I deliver focused comments on market timing once or twice a week.  These are supplemented with daily “Tweets/StockTwits” (see links below).

Update 1-17-2018: Bitcoin Needs to Hold the Line

The most generous trend line I’m willing to draw is shown in the chart below.  Bitcoin must hold this market timing trend line or else the damage increases dramatically beyond the already impressive drawdown off the high. Manage your risk accordingly. Remember however that a test below a line does not mean the break will hold.  Sometimes it takes a few days to see if a certain level or line will hold the trend.  If you are selling, you may want to sell in stages.  If you are buying, buy in stages and exit if the level you bought at breaks. 

BTC-bitcoin-market-timing-chart-2018-01-17-945am

Bitcoin must hold this trend line.

And now back to this week’s analysis of the markets…

1.  SP500 Index Market Timing: We are at another brand new shiny high in the SP500 Index this week.  This has created another breakout above the new prior HIGHER channel after the 11-30-2016 breakout.  Part of this was a “reset” as I’ve called it due to the one time implications of repatriation AND lower tax rates.  The question is whether the second higher reset will stick or not. Eventually markets will have priced in the higher earnings reality of the tax bill.  This may take some time, and this means we cannot rule out even higher resets in the US stock market.

The reaction to the Big Bank earnings on Friday was positive, as the XLF financial component to the SP500 Index rose a market-beating 0.90% while SPY rose 0.65%.  Bank of America (BAC) rose a big 1.73%, anticipating good results this coming Thursday when they report earnings.

The expected deceleration of earnings growth in tech that I’ve mentioned previously could provide some bumps, although growth in tech earnings will be continuing throughout the year.  Yes, that means growth occurring at a decelerating rate through part of the year.  The actual deceleration won’t come out until the April earnings reports of Q1 2018. What tech companies are about to say could change things.   If weaker than expected currently, this could mean tech falters a bit while other sectors pick up the lead, including the financials, health/biotech, and energy (unless oil corrects from the current extended levels).

Won’t U.S. growth slow as China slows?  There was a growing consensus that China was going to slow substantially in the “old China” sectors in 2018, and yet the A and H share ETFs have broken out to new recent highs.  I remain invested in “New China” via KWEB mainly, but exited the A and H shares too early (for 18.75% and 15.43% profits w/o dividends, respectively).  Although there was both technical weakness in those markets and fundamentals that confirmed a slowing, the markets now disagree, and so now my job is to re-enter on pullbacks.  The risk was early re-entry on strength only to see the markets roll over once again.  Yet the early cue offered was the initial technical recovery of the markets.  The new definitive market timing signal on the Chinese markets are the breakouts which confirm, for now, the up trend is intact.

Chinese data is always looked at skeptically, and yet these numerous macro calls were made based on such data.  The Chinese government says they’ll grow at about 6.5% for the year, far above U.S. growth, which is headed to lifting above 3%.  China may be slowing marginally, but is still apparently growing.  The macro China Bears are wrong for now, so says the ultimate arbiter, the market.  

Keep up-to-date during the week at Twitter and StockTwits (links below), where a combined 33,300+ people are joining in…

Follow Me on Twitter®.  Follow Me on StockTwits®.

SP500 Large Cap Index (click chart to enlarge; SPX, SPY):

sp500-index-spx-market-timing-chart-2018-01-12-close

Higher and higher channels.

Survey Says!  Bullish sentiment fell somewhat this week as I expected, given the last extreme.  Sentiment of individual investors (AAII.com) showed a Bull minus Bear percentage spread of  +23.60%  vs. +44.2% last week. Review last week’s data or you won’t be prepared for the next correction – see the data HEREA correction is coming, and we’ll be watching for signs to “lighten up” a bit, so we can take advantage of the sell-off by buying low again.

AAII.Com Individual Investor Sentiment Poll
Bulls Neutrals Bears
48.67% 26.25% 25.07%
Thurs. 12 am CT close to poll

2.  U.S. Small Caps Market Timing:  Small caps, as the next chart shows, have been leading since the 2016 Election low, despite the long pause over the 6 months from late 2016 to 2017.  SPY is shown in yellow in the chart.  You can see that buying the pullbacks of IWM toward the SP500 Index were fruitful.  We will be looking for those entry points.  My bigger exposure in my core portfolio to the small to mid range, as I’ve said, is IJH (midcaps).  I have added exposure to IJH over several years and have not traded one share.

Russell 2000 U.S. Small Cap Index  (click chart to enlarge; IWM, RUT): Longer term view…

iwm-russell-2000-etf-market-timing-chart-2018-01-12-since-2016-election-close

Small caps keeping up.

Here is the chart of more recent price action. We are two days into another breakout.  It often takes 2-3 new highs to confirm such a move.

iwm-russell-2000-etf-market-timing-chart-2018-01-12-close

New high, again…

3. Gold Market Timing: Gold is still lagging the SP500 Index since the 2016 Election, but it’s doing better than one would think in an economy that is growing with low inflation.  This must mean that the market is anticipating greater inflation than is now being reported.  Otherwise, holding gold in greater quantities does not make sense.  TrumpFlation is on its way is what the gold market says to me. 

Asset inflation alone does not mean higher gold prices as we saw with record low gold prices of 251.70 in late August 1999 preceding the tech crash of 2000.  This tells me the markets are anticipating higher inflation.

This is what I call “TrumpFlation”: Fiscal stimulus in the form of tax cuts in an economy with low unemployment leading to inflation.  The best you can say is that gold rising with stocks represents asset inflation, which invariably leads to a collapse of much greater magnitude than would otherwise occur.  Bubbles pop!  A non-bubble becomes a bubble with enough inflation as rates rise rapidly and bonds compete with stocks for better returns.  Gold will work if inflation in fact increases significantly ahead of Federal Reserve action. 

What about a deflationary “pop”? Unfortunately gold does not protect investors in the setting of a deflationary “pop.”  It goes down with stocks as all assets are repriced as in the Great Recession.

An aside on oil (I chart oil at least once but often several times a week on social media [links above]): Oil prices confirm TrumpFlation at the moment despite the fact that oil speculators have gone way out on a limb in being “Uber-Bullish.”  They are all leaning to the Bullish side which usually portends the failure of a rally.  As oil has gone much further than expected, let the market tell you when oil will finally, substantially correct from its current madly Bullish up trend.  The “oil gurus” cannot. 

Gold ETF (click chart to enlarge the chart; GLD): Gold lagging the SP500 Index (yellow line)…

gld-gold-etf-market-timing-chart-2018-01-12-since-2016-election-close

Since the election…

Here you can examine the current important levels. The trend is UP, but GLD now needs a new market timing high above that top green line. 

gld-gold-etf-market-timing-chart-2018-01-12-close

Gold Bull is a sign of coming TrumpFlation.

4. Interest Rate Market Timing – U.S. 10 Year Treasury Note Yield (TNX): Yields rose even further, so I am now back up to 75% of my total financial exposure (in excess of that held in SPY and IJH).  I decided to use XLF exclusively, but suggested adding back Bank of America as well if you wanted greater “beta” in the up trend.  (I sold BAC for 10.00% gains just before the Fed rate hike.)  Higher beta simply means higher returns in a financial sector up trend and losses in a down trend.

The last three price points on the chart below are not particularly Bullish.  You can see the level of 2.621% is not luring in enough buyers.  Pushing through there after these last three days would be impressive.  A reversal here back below the prior breakout would be negative for financials.

U.S. 10 Year Treasury Note Yield (click chart to enlarge; TNX, IEF, TYX,TLT,TBF):

tnx-10-year-treasury-note-market-timing-chart-2018-01-12-close

Rates pause below 2.621%.

Now, as usual, we need to review our three market timing signals (below the chart after you review it…)

Let’s review the three market timing signals together….

MY SIGNAL SUMMARY for a Further U.S. Stock Market Rally:

Stock Signal ON (Small Caps ABOVE “Trigger Line”).  Staying long for now.

Gold Signal OFF (GLD is ABOVE the “Trigger line” which is positive for gold, and usually worse for stocks unless there is inflation moving faster than the Federal Reserve response to it.  Then it’s gold up, stocks down.

Rate Signal ON (10 Year Yield ABOVE the “Trigger Line,” good for stocks, not bonds). 

Thank you for reading.  Would you please leave your comments below where it says “Leave a Reply”… or ask a question…  Pay it forward too by sending the link to MarketTiming.Blog (that link will immediately connect them to this webpage) to a relative or friend.  Thanks for doing that.

Note: My monthly newsletter is now CLOSED to new subscriptions.

Be sure to visit the website for more general investing knowledge at:

Sun and Storm Investing™

Standard Disclaimer: It’s your money and your decision as to how to invest it.

I thank Worden Brothers for the charting system I use to post these charts.  If you want to know more about the charting system I use every day, go to my “Other Resources” page here:  Other Resources   It makes it much easier to follow along with me if you can see the charts and manipulate them on your own computer.  It’s a great investment to have an excellent charting system.  Check it out with a free trial at the link above.

Copyright © 2018 By Wall Street Sun and Storm Report, LLC All rights reserved.

Posted in Bonds, Consumer Discretionary Stocks, Cryptocurrency, gold, investment, investor sentiment, large cap stocks, S&P 500 Index, small cap stocks, Treasuries | Tagged , , , , , , , , , , , , , , , , , , | Leave a comment

Market Timing Brief™ for the 1-05-2018 Close: SP500 Index at All Time High. Earnings Landmines Ahead. Hedge Your Cryptocurrency Profits with Gold and/or Real Estate.

A Market Timing Report based on the 1-05-2018 Close, published Sunday, January 7th, 2018

I deliver focused comments on market timing once or twice a week.  These are supplemented with daily “Tweets/StockTwits” (see links below).

1.  SP500 Index Market Timing: We are at a brand new high with economic data coming in about as strong as previously.  You can review it HERE.  The last bit of data on Friday was ISM services, which was 55.9 for December with consensus at 57.6.

My biggest concern for Q1 is about what tech companies are going to say.  On the one hand, with the new depreciation rules allowing immediate depreciation of capital investments, tech should be helped in addition to the cash they will repatriate and disperse to shareholders.  How much they give to their employees is another thing. We know that the earnings comparisons for Q1 2018 are going to be tough vs. last year, but we don’t know if the market will decide to discount tech stocks as they lay that out in their Q4 2017 earnings reports.  Growth is still expected to be strong, but not as strong on a comparative basis going into Q1 2018.

As I discuss below, sentiment alone says the market will move higher before giving up all of what is gained from here and then some.  But sentiment is not everything.  We still need to use market timing to raise or lower our exposure and keep a close eye on the Federal Reserve, another wild card, given its more hawkish membership starting in 2018 with the new Fed Chair Jerome Powell and several other voting members.  Our third eye will be trained on the economy and the impact of tax policy as it causes the next earnings reports to gyrate about as noted HERE.  A number of companies will see big earnings boosts, but others will have to take huge charges against deferred tax losses first. Earnings start with big bank results out Weds. and Friday of the coming week.

Keep up-to-date during the week at Twitter and StockTwits (links below), where a combined 33,300+ people are joining in…

Twitter® Follow Me on Twitter®.  Follow Me on StockTwits®.

Review the SP500 Index chart and then we’ll look at the small caps.

SP500 Large Cap Index (click chart to enlarge; SPX, SPY):

sp500-index-spx-market-timing-chart-2018-01-05-close-v2

Bull Still Running!

Survey Says!  Sentiment of individual investors (AAII.com) showed a Bull minus Bear percentage spread of  +44.2% vs. +32.02% last week.  I reported this week on social media about similar high sentiment numbers in the past.  That number is truly “off the wall Bullish.”  We’ve finally (it’s been a LONG time waiting for this…) come to a point where future gains, meaning gains prior to the next significant correction, will likely be wiped out, if we are to believe history.  This does not mean the end of the Bull market, but it means a noticeable bump in it on the horizon.

Here are the extremes prior to this one:

11-18-2004: 41.7%

7-14-2005: 43.9%

11-24-2005: 41.3%

12-23-2010: 46.9%

These big sentiment numbers did not mean the immediate end of the up trend of the SP500 Index, but the temporary top occurred shortly thereafter (within several months) and all of the gains were given up and then some.  All but the one following the 2010 sentiment top were between 6-8% corrections.  The 2011 drawdown was 21.59% which is technically what the mainstream media calls a “Bear Market” as it exceeded 20%.  It was really just a big correction in a Bull market.

The Bottom Line: You can probably hold through the coming drawdown, but one never knows how deep the next one will go, so I will be looking for a place to lighten up my excess exposure on the long side as the market climbs higher.  I will likely allow for a small loss off the high rather than exiting too early.  Then we’ll attempt to buy low.  Does it always work?  No, because the corrections are sometimes too shallow.  Did we profit most recently in a big way by buying low in the big 2015-2016 corrections?  Yes.

AAII.Com Individual Investor Sentiment Poll
Bulls Neutrals Bears
59.75% 24.69% 15.56%
Thurs. 12 am CT close to poll

2.  U.S. Small Caps Market Timing: Small caps are now running neck and neck with large caps.  There is inherently more risk (beta) in small caps, so they should be doing better than large caps.  Interest rates have a sizable influence on their performance as the Russell 2000 has a hefty exposure to financials at 17.17% per Morningstar.  Still, the small caps are still near all time highs, so the lag in performance is something to watch, most likely not a signal to bail.

Russell 2000 U.S. Small Cap Index  (click chart to enlarge; IWM, RUT):

iwm-russell-2000-etf-market-timing-chart-2018-01-05-close

Small caps not quite back to a new all time high.

3. Gold Market Timing: Gold is now consolidating waiting for a “rate decision,” so to speak.  Follow the 10 Year Yield and you’ll like have gold right in the short term.  GLD is headed to a market timing test of 128.32 to 131.15, the two prior highs.  The steady up trend in December that preceded the current consolidation was encouraging, but recall that a strong economy and higher interest rates work against gold as an investment.  Preserve trading profits from here.  I continue to own GLD as insurance against fiat currency.   I also own it as a hedge against a complete collapse in the cryptocurrency markets based on massive worldwide government intervention.  This probably won’t happen, but remember that FDR confiscated 100% of the gold owned by Americans when it suited him.

Bitcoin cannot replace gold completely as a store of value, but on a marketing basis it’s far sexier than the yellow stuff, and more importantly, it will have growing utility.  I am holding both.  If you followed me recently here and on social media and bought cryptocurrencies, you are “up nicely.”  If you have massive or at least very large gains in cryptocurrencies, consider selling your principle plus 100% profit and buy gold and/or real estate with it.  Keep no less than half of your original cryptocurrency investment, IF your position size is reasonable.  It’s your money as I say, so make your own decision, but I am sharing what a wise investor would do with very large gains.

If you don’t understand what I just said, read about position sizing before you lose large amounts of money.  Let’s just say that if you have more than 10% of your assets in cryptocurrencies AND gold (i.e. total > 10%), you are taking risks.  Ten percent is double the usual exposure recommended for gold alone.  Can you afford to lose all the money invested in cryptocurrencies and still be OK with it?  Do you have a plan to exit at a certain point and will you be awake at 3 am to execute the crypto trades required to exit a collapse? 

Gold has been a store of value for thousands of years.  The Egyptians first smelted gold around 3600 BC.  Cryptocurrencies started with Bitcoin in 2009.  Diversify your crypto profits.

Gold ETF (click chart to enlarge the chart; GLD):

gld-gold-etf-market-timing-chart-2018-01-05-close

Gold waiting for interest rates for direction.,

4. Interest Rate Market Timing – U.S. 10 Year Treasury Note Yield (TNX): Yields rose, so I added part of my financial exposure back (see social media links), but the direction of rates in the short term has not yet been decided.  The TNX close was at 2.476% on Friday, which is barely above 2.475% resistance.

The chart interpretation is that the 10 Year Yield moved down to test the prior triangle and then bounced.  We are still waiting to see if there will be a breakout, but the financials have moved to start a marginal new breakout over the past 2 trading days (XLF).  We’ll likely see a more substantial move next week with earnings coming out for some big banks as mentioned.

U.S. 10 Year Treasury Note Yield (click chart to enlarge; TNX, IEF, TYX,TLT,TBF): (“Rate Triangle” in yellow…)

tnx-10-year-treasury-note-market-timing-chart-2018-01-05-close

Rates moving still higher?

Now, as usual, we need to review our three market timing signals (below the chart after you review it…)

Let’s review the three market timing signals together….

MY SIGNAL SUMMARY for a Further U.S. Stock Market Rally:

Stock Signal ON (Small Caps ABOVE “Trigger Line”).  Staying long for now.

Gold Signal OFF (GLD is ABOVE the “Trigger line” which is positive for gold, and worse for stocks). 

Rate Signal ON (10 Year Yield ABOVE the “Trigger Line,” good for stocks, not bonds). 

Thank you for reading.  Would you please leave your comments below where it says “Leave a Reply”… or ask a question…  Pay it forward too by sending the link to MarketTiming.Blog (that link will immediately connect them to this webpage) to a relative or friend.  Thanks for doing that.

Note: My monthly newsletter is now CLOSED to new subscriptions.

Be sure to visit the website for more general investing knowledge at:

Sun and Storm Investing™

Standard Disclaimer: It’s your money and your decision as to how to invest it.

I thank Worden Brothers for the charting system I use to post these charts.  If you want to know more about the charting system I use every day, go to my “Other Resources” page here:  Other Resources   It makes it much easier to follow along with me if you can see the charts and manipulate them on your own computer.  It’s a great investment to have an excellent charting system.  Check it out with a free trial at the link above.

Copyright © 2018 By Wall Street Sun and Storm Report, LLC All rights reserved.

Posted in Bonds, Consumer Discretionary Stocks, Cryptocurrency, gold, investment, investor sentiment, large cap stocks, S&P 500 Index, small cap stocks, Treasuries | Tagged , , , , , , , , , , , , , , , , | Leave a comment

Market Timing Brief™ for the 12-29-2017 Close: Staying Invested, Preserving Big Profits, and Watching Market Sectors On Shorter Time Frames. Gold Rallies as Rates Move Lower, Surprising Rate Bulls.

A Market Timing Report based on the 12-29-2017 Close, published Sunday, December 31st, 2017

I deliver focused comments on market timing once or twice a week.  These are supplemented with daily “Tweets/StockTwits” (see links below).

1.  SP500 Index Market Timing: The index is barely off the 2017 high as of the Friday close.  Now that fiscal stimulus is on the way in the form of tax cuts, the largest for corporations, further upside is likely.  The Chicago PMI which includes both manufacturing and service components was at 67.6 as reported this past week, above the 2011 and 2014 highs.  That’s impressive. 

The SPX market timing “Channel Reset” as I’ll call it may have resulted from the Tax Bill.  There is a new up channel above the level of the prior channel (see chart below).  If this goes away, and the price falls into the prior channel, it would be a negative sign for the rally.

Housing prices are rising faster than the rate of inflation, up 6.4% Y/Y per the Case Shiller data.  The Federal Reserve has managed to inflate housing prices that are drawing near 2006-2007 peak levels as shown in this Nov.29th chart.  In that way at least, the Fed has in fact been able to produce inflation.  Stock and bond prices have been inflated as well.  Some say the risk to stock prices is big now.  We are staying invested for now, but protecting profits in more volatile holdings.

We’ve done very well this year in the US market predominately in SPY and QQQ.  A big part of those gains resulted from buying off the 2015-2016 lows and again on 11-01-2016 just before the election (time stamped on social media).  Buying mid caps on dips through 2016 paid off too.  As my followers know, I buy fear not greed. Remember that dip buying only works well in a Bull market (unless you are trading bounces quickly), so one day we’ll need to have a lower exposure level to stocks.

Gains in IJH midcaps were a bit less for 2017 at 16.15% with dividends, but over time they tend to return more.  The immediate post-2016 Election run-up in midcaps and small caps worked against them for total 2017 returns as they were running ahead of the S&P 500, so the perceived underperformance over longer time periods is artificial.

My honing down on some sector picks last year showed mixed results with a missed opportunity by owning XLE and did not significantly beat the market in the others.  This year, let’s look at sectors each quarter one at a time and preserve big profits when appropriate.  The data below shows the difficulty of making any year long predictions.  Energy was down significantly and steadily to the August low, but was up strongly from that low into the end of 2017.  That meant that owning it at the start of the year was “bad” and owning it from August on was “good.”

What the market is doing NOW is far more important than a theoretical prediction based on the facts of one particular moment.  I made up for some of the XLE losses by reinvesting the proceeds in the rising market, but needless to say, it did not help over the year long period.  XLV and IBB were almost identical in total returns vs. the SPY.

My conclusion is that making year long predictions is foolish and potentially misleading to those not willing to trade in and out of positions.  As you see every week on Twitter and StockTwits, I do not “sit there” if the market is moving against me.  When I did, I paid for it, so now I don’t!

ETF 12/30/2016 12/29/2017 Dividends  End 2017 w Div Gain/Loss
SPY 223.53 266.86 4.802 271.662 21.53%
IBB 88.45 106.77 0.71987 107.50 21.53%
XLV 68.94 82.68 1.218 83.898 21.70%
XLE 75.32 72.26 2.191 74.451 -1.15%

Investment in China paid off this year in FXI, which had you entered on Jan. 1 and exited on 12-06-17 would have resulted in a total gain with dividends of 29.75% for that 2017 exit point.  But China has not been straight up, so the gain from my purchases for CNYA (Chinese A Shares w/o dividends) was 18.75% and 15.43% for FXI (H shares w/o dividends).  KWEB helped boost the overall China returns with a total return of 69.73% for 2017.  My remaining KWEB position shows a paper profit of 52% from purchase, with 20% of the total buys sold 10-25-17 for a 22.60% gain after prior buys/sells that were profitable along the way.

Update 1-02-2018: If you have not sold FXI or CNYA yet, you may want to wait a bit to see if the bounce in the New Year sticks.  At the moment, FXI is up a big 2.99% for Monday Jan 2nd.  The consensus view of China is “further slowing,” but we’ve seen how China has wiggled out of slowing growth before – in 2017.  It may happen yet again. 

Given the problems with year long forecasts, there are still areas of the market we may want to be over-exposed to going into 2018.  And some like healthcare and biotech could prove treacherous if Trump decides to negotiate drug prices despite early indications he’s fallen in line with the GOP line.  If you follow me this year, you’ll see my entry and exit points at the social media links below.  Please follow me on both networks (Twitter and StockTwits) as outages occasionally occur.

Keep up-to-date during the week at Twitter and StockTwits (links below), where a combined 33,308 people are joining in…

Twitter® Follow Me on Twitter®.  Follow Me on StockTwits®.

Review the SP500 Index chart and then we’ll look at the small caps.

SP500 Large Cap Index (click chart to enlarge; SPX, SPY):

Market timing the SP500 Index (SPY, SPX).

Coming off all time high.

Survey Says!  Sentiment of individual investors (AAII.com) showed a Bull minus Bear percentage spread of  +32.02% vs. +24.88% last week.  The last time the sentiment spread was even close to 30% was on 11-23-16 when it was 27.8%.   This was followed by massive 2017 gains as you know.

AAII.Com Individual Investor Sentiment Poll
Bulls Neutrals Bears
52.65% 26.72% 20.63%
Thurs. 12 am CT close to poll

It was above 30% last on 11-26-14 at 31.4%.  That was near the Nov. highs in the market, which followed a significant decline in October.  Higher highs were made after several Dec. and Jan. downdrafts, but these gains were lost in Aug. 2015 and again on the second low which occurred during January to February 2016.  But this does not prove anything that we can use today as a predictor!  The current level of positive sentiment certainly does not prohibit additional gains from here as long as the economic and earnings data remains positive.

What is the risk of lowering overall market exposure?  The S&P 500 ran up an additional 15.23% to 46.11% at the 1850.84 high after sentiment hit 30.60% on 7-10-2013 on the rally off the June 2012 low.  That represents the gains from the retracement low of 6-04-2012.  This means that by taking gains too aggressively without using other indicators beyond sentiment, we could lose out on major further gains.  As long as the dominant chart trend remains up and the economic trend is still up, we’ll remain long and look for entry points during sell-offs. 

2.  U.S. Small Caps Market Timing: Performance of small and mid caps has been mid double digits, which means relatively weak this year vs. large caps.  If interest rates don’t climb, small caps will experience a drag this year as well; however, IWM is leading vs. the SPX off the August low and this leadership could persist into 2018.

Russell 2000 U.S. Small Cap Index  (click chart to enlarge; IWM, RUT):

iwm-russell-2000-etf-market-timing-chart-2017-12-29-close

Small Caps coming off a top, but still near all time highs. Performance has been relatively weak this year.

3. Gold Market Timing: Gold is showing surprising strength.  Interest rates have been easing off the recent high.  If the Fed continues raising rates at a steady pace, gold will suffer however.  Protect your profits if you trade gold in 2018. We previously had a technical break to the downside of that prior triangle and now we have one to the upside!  Follow rates and you’ll likely get gold right in the absence of big geopolitical upsets.  In doing so, consider rates around the world, not just in the U.S.  Remember US rates should rise if the economy continues to do well, but foreign rates could pressure ours.

Gold ETF (click chart to enlarge the chart; GLD):

gld-gold-etf-market-timing-chart-2017-12-29-close

Gold rallies as rates fall.

4. Interest Rate Market Timing – U.S. 10 Year Treasury Note Yield (TNX): Rates went higher than I thought they would, with the 10 Year Yield hitting a top of 2.499%.  There is room for more downside for interest rates.  The fall since then has pressured financials and helped gold, precisely as my “Playbook” states HERE.

U.S. 10 Year Treasury Note Yield (click chart to enlarge; TNX, IEF, TYX,TLT,TBF): (“Rate Triangle” in yellow…)


tnx-10-year-treasury-note-market-timing-chart-2017-12-29-close

10 Year Yield falls from 2.499%.

Now, as usual, we need to review our three market timing signals (below the chart after you review it…)

Let’s review the three market timing signals together….

MY SIGNAL SUMMARY for a Further U.S. Stock Market Rally:

Stock Signal ON (Small Caps above “Trigger Line”).  Staying long for now.

Gold Signal OFF (GLD is below the “Trigger line” which is positive for gold, and worse for stocks). 

Rate Signal ON (10 Year Yield above the “Trigger Line,” good for stocks, not bonds). 

Thank you for reading.  Would you please leave your comments below where it says “Leave a Reply”… or ask a question…  Pay it forward too by sending the link to MarketTiming.Blog (that link will immediately connect them to this webpage) to a relative or friend.  Thanks for doing that.

Note: My monthly newsletter is now CLOSED to new subscriptions until late this year.  I’ll let you know here if and when it reopens.

Be sure to visit the website for more general investing knowledge at:

Sun and Storm Investing™

Standard Disclaimer: It’s your money and your decision as to how to invest it.

I thank Worden Brothers for the charting system I use to post these charts.  If you want to know more about the charting system I use every day, go to my “Other Resources” page here:  Other Resources   It makes it much easier to follow along with me if you can see the charts and manipulate them on your own computer.  It’s a great investment to have an excellent charting system.  Check it out with a free trial at the link above.

Copyright © 2017 By Wall Street Sun and Storm Report, LLC All rights reserved.

Posted in Bonds, Consumer Discretionary Stocks, Cryptocurrency, gold, investment, investor sentiment, large cap stocks, S&P 500 Index, small cap stocks, Treasuries | Tagged , , , , , , , , , , , , , , , | 2 Comments

Market Timing Brief™ for the 12-15-2017 Close (Update 12-27-2017): The Tax Plan Playbook. SP500 Index Breaks Out Yet Again. Gold Steady After Fall while Treasuries Procrastinate a Very Big Decision!

A Market Timing Report based on the 12-15-2017 Close, published Sunday, December 17th, 2017

I deliver focused comments on market timing once or twice a week.  These are supplemented with daily “Tweets/StockTwits” (see links below).

12-27-2017 Update: S&P500 Index Sector Market Timing Chart Update (with QQQ added), since the 11-15-2017 market timing low: XLU is the biggest loser.  The order from top down is in order of the color key at the top of the chart shown below.  XLI is at the top, running neck and neck with XLE, XLY, and XLF.   Running a bit behind the SPY are XLK, QQQ, and XLV. Note the two long yellow lines represent the prior channel the SPY was respecting.  We’re running above the channel still, implying either a Tax Plan reset or a stretched market, take your pick.  It’s likely a bit of both.

Some say Tech will lead the Bull Market into 2018, but as pointed out, the earnings comparisons will be tough for tech coming into Q1 2018.  Is the recent relative chart weakness a harbinger?  The charts will answer this, but overloading on tech ahead of the tough earnings comparisons could backfire.  If you buy into a “Tech 2018 leadership thesis,” be sure to buy low, not high. 

I’ll have more by Jan 1st!  But be sure to read the Tax Bill Trade set-up comments below…

spx-sector-market-timing-from-11-15-2017-low-xli-xle-xly-xlf-xlp-xlb-spy-xlv-qqq-xlk-xlu

Market Timing the S&P 500 Index Sectors

This is the issue from the mid-month close, but gives you the set-up for the Tax Bill Trade… (next issue out by Jan 1st)

1.  SP500 Index: The Federal Reserve kept to the script I reviewed last weekend and remained “mildly hawkish.”  They raised rates by the expected 0.25% and expect to raise rates a total of three times in 2018 as they thought they would before.  No further hike is expected until March, which is handicapped at only 62.8% odds (for at least one hike then) per the CME numbers.

That stance resulted in my “Canary in the Trump Gold Mine” a.k.a. Bank of America (BAC) selling off a bit from its high this week with a positive but “inside day” on Friday (inside the range of the prior day; actually it hit the high end of the range and the low on Fri. was barely above the low of Thurs.).   I sold BAC near the high in anticipation of a pullback, since the prior hikes this year and last were met by the same. This was also true for XLF, the SPX financials as I said, although the beta there is lower, so the potential gain by selling high and buying low lessens.  Still, I sold both near the highs to generate a bit of outperformance of the market.  That’s the market timing plan at least.

Depending on how interest rates behave, I may buy back some financial exposure this week.  Sometimes the swings lower don’t allow for the room to make good trades around core positions.  This may have been one of those times.  My core positions are noted in the trading plan you’ll read a bit later in this post.  The sector bets are trades around the core to augment returns.

I also dumped oil exposure in the form of XLE (SPX Energy ETF) at a slight profit.  I expect oil to trade down from here as charted at the links below.  I like slight profits better than bigger losses.  Europe and China are slowing now, so oil could ease further than is thought by overly Bullish speculators.

Keep up-to-date during the week at Twitter and StockTwits (links below), where a combined 33,234 people are joining in…

Twitter® Follow Me on Twitter®.  Follow Me on StockTwits®.

Review the SP500 Index chart and then we’ll look at the small caps.

SP500 Large Cap Index (click chart to enlarge; SPX, SPY):

sp500-index-spx-market-timing-chart-2017-12-15-close

Huge fund flows push the index to a brand new high.

Survey Says!  Sentiment of individual investors (AAII.com) showed a Bull minus Bear percentage spread of  +16.87% from +2.66% vs. last week.  Given the pattern of sentiment vs. trading since the 2016 election, I see up to a potential week of further upside at which point sentiment will be back to the low 20’s, but only if interest rates are stable to UP from here.  IF interest rates move down on Monday, there could be some profit taking for several days, followed by a bit of a rally into Christmas weekend.  Tax loss selling could hit between now and 12-31-17. 

Thurs. 12 am close to poll Bulls               45.00% Neutrals 26.88% Bears      28.13%

2.  U.S. Small Caps: There is renewed interest in small caps after the Fed’s action to stay on course with their “mild hawkishness” with slowly rising rates.  I am only 0.35% behind the small cap index from where I sold on 12-11 ahead of the Federal Reserve statement, as the gains seen on Friday were reduced into the close as interest rates softened.  Their performance will be similarly tied in with interest rates on Monday.  I’ll be watching for market timing entry points, as small caps should benefit from rising rates (esp. the financial component) and a rising US dollar.  But IF the rate picture softens into Q1 with falling oil and commodity prices, small caps will not do well.  That’s the risk.  Falling rates would imply a slower economy and small caps are sensitive to growth, because without it, they fail to become mid caps!

One reason to be out of or less exposed to small caps at the moment is that they have been weak compared to large caps since 11-29.  It has been 9 days since the last high was achieved vs. the new high on Friday for the S&P500 Index (SPX).  This lag is also true of midcaps.  The Bullish argument?  Remember that if US growth continues as I expect it will even with slight slowing elsewhere in the world into Q1, then small and mid caps should catch up.  Short term I expect rates to drive the small cap index (up or down; up on higher rates; down on lower), but longer term, growth will kick in and push them higher.  This is the plan which I assess on a continuing basis.

Also beware of tax loss selling into the end of the year especially in small caps, but also in any other stock that has been beaten up this year.

Russell 2000 U.S. Small Cap Index  (click chart to enlarge; IWM, RUT):

iwm-russell-2000-etf-market-timing-chart-2017-12-15-close

Healthy backdrop would include slowly rising rates and economic growth.

3. Gold: Rates moved down and gold moved up a bit after the Federal Reserve FOMC decision on Wednesday.  The rate hike dance continues.  Gold is only good as insurance against higher and higher national debt.  Trump in his own words “loves debt,” so it’s not surprising he’s willing to add to it and further weaken our currency.  I am an independent fiscal conservative who believes BOTH parties are irresponsible when it comes to debt.  In the meantime, hold some gold and perhaps some cryptocurrency, if you are willing to spend the time to use market timing to buy the lows rather than chasing higher prices like most of the newbies. 

Gold ETF (click chart to enlarge the chart; GLD):

gld-gold-etf-market-timing-chart-2017-12-15-close

Gold is not the place to be except as dollar insurance.

4. U.S. 10 Year Treasury Note Yield (TNX): I bought short term Treasuries yet again at the top of the “Rate Triangle” (in yellow on the chart below).  My market timing was accurate.  The resolution of this triangle is going to drive markets in predictable directions I’ve laid out this week and last.

U.S. 10 Year Treasury Note Yield (click chart to enlarge; TNX, IEF, TYX,TLT,TBF): (“Rate Triangle” in yellow…)

tnx-10-year-treasury-note-market-timing-chart-2017-12-15-close

The “Rate Triangle” still Rules!

NOW for the “Tax Plan Playbook”

1. Get long Big Spenders as they get the greatest tax breaks as is always the case for GOP tax bills.  I’ll be looking for market timing spots to add broad exposure to consumer discretionary stocks, just as I added to Disney (DIS) on that basis and on the basis of the revitalization of their business through the purchase of Fox assets.  I used market timing technicals to enter and then add to my initial Disney position.  Enter consumer discretionary stocks on pullbacks.

2. Stick with Large Caps in general: Money will continue to pour into large cap US stocks.  That means the S&P500 Index, SPY or equivalents.  Buy the lows!  Do not chase the highs.

3. Big Tech with Growth: Repatriation will help big cap tech despite the argument that they already pay lower corporate tax rates.  Proxies for big tech include QQQ, which gives you both a heavy 40%+ tech exposure in the case of QQQ as well as large cap exposure from #2 above.  Another choice, the XLK ETF is all big tech as it represents the SP500 Tech stocks.  Semiconductor stocks are another possible exposure to add on market timing pullbacks – like the current one incidentally.  QQQ seems like a better match with #2 and #3 and it includes consumer discretionary exposure such as AMZN and more.  Note also that QQQ closed at an ALL TIME HIGH this Friday along with SPY.  Buy pullbacks.

4. “Other Caps”: Avoid US small caps and financials if rates soften and enter them if the the rate triangle resolves to the upside  Small caps will do well as long as rates rise slowly and stay within a reasonable range, so as to not shut down economic growth, which the Federal Reserve has a knack for doing.  I am going to suggest maintaining a core mid cap exposure as they perform best over long periods of time (e.g. IJH), but buy them on pullbacks to take advantage of volatility.

5. Stick to individual shorter term Treasuries/Bonds you can hold to maturity (and avoid bond funds for the next few years if possible), but it may be possible to trade a break of the rate triangle below the lower market timing trend line in the triangle.  If rates crash, bonds rally.

6. Stay out of gold unless inflation picks up except as insurance against dollar weakness unless the “Rate Triangle” breaks to the downside.

7. etc. There are other pointers for foreign markets you will see only if you follow my messages on social media (links above).   Have to save some gems for later!

Bookmark this page so you can refer back to this playbook.  Let me know what you think by leaving your comments below…

Now, as usual, we need to review our three market timing signals (below the chart after you review it…)

Let’s review the three market timing signals together….

MY SIGNAL SUMMARY for a Further U.S. Stock Market Rally:

Stock Signal ON (Small Caps above “Trigger Line”).  Staying long for now.

Gold Signal ON (GLD is below the “Trigger line” which is negative for gold, and better for stocks). 

Rate Signal ON (10 Year Yield above the “Trigger Line,” good for stocks, not bonds).  Watch the yellow triangle this week!

Thank you for reading.  Would you please leave your comments below where it says “Leave a Reply”… or ask a question…  Pay it forward too by sending the link to MarketTiming.Blog (that link will immediately connect them to this webpage) to a relative or friend.  Thanks for doing that.

Note: My monthly newsletter is now CLOSED to new subscriptions until late this year.  I’ll let you know here if and when it reopens.

Be sure to visit the website for more general investing knowledge at:

Sun and Storm Investing™

Standard Disclaimer: It’s your money and your decision as to how to invest it.

I thank Worden Brothers for the charting system I use to post these charts.  If you want to know more about the charting system I use every day, go to my “Other Resources” page here:  Other Resources   It makes it much easier to follow along with me if you can see the charts and manipulate them on your own computer.  It’s a great investment to have an excellent charting system.  Check it out with a free trial at the link above.

Copyright © 2017 By Wall Street Sun and Storm Report, LLC All rights reserved.

Posted in Bonds, Consumer Discretionary Stocks, Cryptocurrency, gold, investment, investor sentiment, large cap stocks, S&P 500 Index, small cap stocks, Treasuries | Tagged , , , , , , , , , , , , , , , , , , , , , | Leave a comment

Market Timing Brief™ for the 12-08-2017 Close: If the Fed is not “Mildly Hawkish” This Week, Buckle Your Seatbelt. Gold In Trouble. Rates Will Decide On Direction Soon – Like This Week!.

A Market Timing Report based on the 12-01-2017 Close, published Saturday, December 2nd, 2017

I deliver focused comments on market timing once or twice a week.  These are supplemented with daily “Tweets/StockTwits” (see links below).

1.  SP500 Index: Did you buy this week rather than sell at the lows?  I hope you did, and I’ll go over the progress made in these positions in a moment.

But first, a bird’s-eye view.  Looking at the S&P500 Chart, classically, one would say it is overbought as it’s trading above that upper channel in market timing terms.  However, there could have been somewhat of a reset higher due to the passage of tax reform, which was previously not assumed though hoped for.  I’ll say this: the market will be healthier if it consolidates (goes sideways) for a bit before heading higher.  I cannot say it will do so, as sentiment is still too neutral (see stats below).

The tax boon to companies will be big for 2018 if the Tax Reform Bill passes and adds measurably to earnings to the tune of 10%, but this varies for each company (there are some losers, so check your stocks out!).  We had to do some market timing around tech last week, which is so far still in the green.  If you look at the SP500 Index chart below, it bounced back up to a new closing high and even the QQQ was nicely off its lows (I also bought that near the bottom as noted on social media this past week, along with Facebook; one other buy is also noted).

The big or not so big deal this week will be the Federal Reserve meeting.  The 0.25% rate hike to a range of 1.25-1.50% is expected by nearly everyone per the CME Group with 9.8% expecting a 0.50% hike, which would be taken badly, because it’s so unexpected.  The number of hikes they predict for the coming year will be the juice of the meeting though.  The Federal Reserve has the chance to mess things up in this recovery by raising rates too quickly ahead of the world’s economic growth.  It could even bring us into recession as that has happened before.  If they become marginally more dovish instead of hawkish, the market may question the strength of the economy, and hence the valuation of the stock market.  For this reason, watch carefully for which way they slant things.

What will the degree of Federal Reserve hawkishness/dovishness do to the markets in a bit more detail?  “Mildly hawkish” would mean slowly rising rates, and would be well received, particularly by the financials, because that is their current stance.  “Very hawkish” would be totally out of step with slowing in regions like Europe and even China and would be Bearish for stocks in general, bonds, and initially gold, as it could eventually lead to a Fed induced recession.  It also could mess with the Christmas buying season and 2017 GDP for the Fed to become more hawkish in mid-December.  “Marginally more dovish” would hurt the dollar and financials, while helping emerging markets , US tech, and to a lesser extent gold, because it would mean the economy will be growing with low inflation, which hurts gold, because it’s a non-productive asset.   Lower rates on their own would be marginally helpful to gold, however.  There is no case to be made for “Very dovish” at this point in the recovery.

My prediction? Steady as she goes, meaning “mildly hawkish.”  Anything else will cause upset in opposing directions to current trends.  The Fed remaining “Mildly Hawkish” this week would allow the current trends to persist at least for the short term.  Chair Yellen is out at the beginning of February to be replaced by Jerome Powell, and this is her last news conference, and she does not want or need to create trouble on the way out.  Softness in the world economy may cause the Federal Reserve to at least dampen expectations for further rapid rate hikes, so we’ll have to follow this carefully.

Keep up-to-date during the week at Twitter and StockTwits (links below), where a combined 32,957 people are joining in…

Twitter® Follow Me on Twitter®.  Follow Me on StockTwits®.

SP500 Large Cap Index (click chart to enlarge; SPX, SPY):

sp500-index-spx-market-timing-chart-2017-12-08-close

SP500 Index bounces back to a new all time closing high.

Survey Says!  Sentiment of individual investors (AAII.com) showed a Bull minus Bear percentage spread of  +2.66% vs. +4.33% last week.  Sentiment is clearly not in the way of this market going up or down frankly, but as we are at an all time closing S&P500 Index high with lagging sentiment, I remain long and Bullish.  I have a bit more cash as my reports on social media show (see links above), because I’ve taken off exposure in China as mentioned there.  I’ve replaced some of that with US exposure.

Thurs. 12 am close to poll Bulls               36.88% Neutrals 28.90% Bears      34.22%

2.  U.S. Small Caps: Speaking of market timing in action, I did use it to buy the dip as they say, but perhaps could have added more.  Small caps are holding the prior breakout.  If that goes away with the Fed or other news, we’ll be retesting the 144.25 area at least.  I am not betting on that happening, but they need to make progress this next week and have a good response to the Fed’s comments.  The financial component of the Russell 2000 won’t want anything less than “Mildly Hawkish” as explained above.

Russell 2000 U.S. Small Cap Index  (click chart to enlarge; IWM, RUT):

iwm-russell-2000-etf-market-timing-chart-2017-12-08-close

Small caps are back up from their swoon.

3. Gold: Gold was hurt badly, s0 I hope you followed my market timing advice and were out of your gold trades with the first break of the yellow triangle.  If you did, you saved yourself the next drop in gold prices.  I expect continued economic growth under the Trump plan (like him or not), and that will hurt gold as I’ve explained for months now. 

Gold ETF (click chart to enlarge the chart; GLD):

gld-gold-etf-market-timing-chart-2017-12-08-close

Gold hit hard as I predicted on the 1st break of the triangle.

4. U.S. 10 Year Treasury Note Yield (TNX): My market timing on rates last Sunday was accurate.  Rates held the low I wrote about.  I continue to look for buying points for short term bonds at this point, followed by longer term bond exposure in individual bonds as rates move higher.  If the Federal Reserve manages to keep rates range bound below 3% or so, you’ll still do OK in bond funds, but try to avoid them if you can until economic growth starts to slow. Buy individual bonds at shorter durations and ladder them out in duration and yield as rates go higher.

Do you see the yellow triangle?  Note that as gold cut through the base of its daily triangle, rates were moving up as I said they would last week.  Any breach of the rate triangle to the downside will be taken as the Federal Reserve being more dovish, the consequences of which I’ve already explained above.  Watch which way yields cut, up or down, because it’s going to have a BIG impact on the market, obviously particularly on anything directly rate sensitive like the financials.

U.S. 10 Year Treasury Note Yield (click chart to enlarge; TNX, IEF, TYX,TLT,TBF):

tnx-10-year-treasury-note-market-timing-chart-2017-12-08-close

Rates are about to make an important directional decision.

Now, as usual, we need to review our three market timing signals (below the chart after you review it…)

Let’s review the three market timing signals together….

MY SIGNAL SUMMARY for a Further U.S. Stock Market Rally:

Stock Signal ON (Small Caps above “Trigger Line”).  Staying long for now.

Gold Signal ON (GLD is below the “Trigger line” which is negative for gold, and better for stocks).  Watch out below.  Could fall to the lower support level shown.

Rate Signal ON (10 Year Yield above the “Trigger Line,” good for stocks, not bonds).  Watch the yellow triangle this week!

Thank you for reading.  Would you please leave your comments below where it says “Leave a Reply”… or ask a question…  Pay it forward too by sending the link to MarketTiming.Blog (that link will immediately connect them to this webpage) to a relative or friend.  Thanks for doing that.

Note: My monthly newsletter is now CLOSED to new subscriptions until late this year.  I’ll let you know here if and when it reopens.

Be sure to visit the website for more general investing knowledge at:

Sun and Storm Investing™

Standard Disclaimer: It’s your money and your decision as to how to invest it.

I thank Worden Brothers for the charting system I use to post these charts.  If you want to know more about the charting system I use every day, go to my “Other Resources” page here:  Other Resources   It makes it much easier to follow along with me if you can see the charts and manipulate them on your own computer.  It’s a great investment to have an excellent charting system.  Check it out with a free trial at the link above.

Copyright © 2017 By Wall Street Sun and Storm Report, LLC All rights reserved.

Posted in Bonds, Cryptocurrency, gold, investment, investor sentiment, large cap stocks, S&P 500 Index, small cap stocks, Treasuries | Tagged , , , , , , , , , , , , , , , , | Leave a comment

Market Timing Brief™ for the 12-01-2017 Close (12-03-2017 Bitcoin Chart Update): The Battle of Tax Cuts vs. Flynn. Stocks are Still Stretched. Gold Still Waiting for a Big Move. Rates Will Likely Press Higher.

A Market Timing Report based on the 12-01-2017 Close, published Saturday, December 2nd, 2017

I deliver focused comments on market timing once or twice a week.  These are supplemented with daily “Tweets/StockTwits” (see links below).

12-03-2017 Bitcoin Update: How High Should it Be?  It Depends….

The “Utility” of the coin is the real underlying driver and the size of the network per Metcalfe’s Law is part of that utility, but chart-wise, the answer depends on how you draw the market timing channel from the base.  If you go all the way back to the start of the 2017 incline (and use a log plot as should be done), we’re only about mid-channel (slightly below there in fact, as current price is 11,310 at 10:53 pm ETC on Sunday at Bittrex which tends to be  a bit low compared to other sites like Coinbase and Gemini).

BTC-bitcoin-market-timing-chart-2017-12-03-935am

Bitcoin charted from the 2017 incline.

Now back to this week’s action packed issue…well, it was an exciting week in many ways!

1.  SP500 Index:  A Big Swoon hit the stock markets Friday requiring rapid market timing reactions with both the Senate Tax Reform Bill in play as well as the revelation of a Michael Flynn plea bargain in which he admitted lying to the FBI.  Since our dear President is not always to be believed (ask the business people he swindled; I interviewed one and spoke to a source about a second incident; many others have been fully reported), we cannot know if Trump’s comment is true, that what Flynn did was legal, though his lying was illegal.

This means there is an non-measurable risk to the markets, which only tells us not to overdo it until the air clears.  What that is to you, you must decide on your own exposure levels to the stock markets of the world.  I am still overexposed to the markets vs. my usual maximum exposure as I call it and you can read my latest exposure summary at either of the social media links immediately below.

I added back some Facebook exposure after it fell to around 174 on Weds. and sold it for a gain of 0.83% in a day, and then re-entered at 174.56 (also added very short term Treasury exposure, which beats the bank, and brought down cash level, and sold some China exposure taking profits on the recent re-buys).  The Facebook close was still up from my buy by a fraction at 175.00, but down 1.17% for the day.  I would have added more exposure elsewhere had the deepest dive lasted for more than 2 minutes.  Dip buyers were very active off the low.  There was about a 37% recovery of “swoon losses” within 4 minutes, although there was a slight pullback after that which lasted all of 7 minutes.

The market bounced once the tax bill passing was assured by various holdout Senators and we are back to a “Stretched” status.  The market timing signals are the “Stretch Marks” as I called them this week.  They signal “don’t buy” until the next pullback.  I will be pulling the trigger when it’s appropriate based on a relief of the current market stretch above the upper yellow channel line seen in the chart below.

Keep up-to-date during the week at Twitter and StockTwits (links below), where a combined 32,720 people are joining in…

Twitter® Follow Me on Twitter®.  Follow Me on StockTwits®.

SP500 Large Cap Index (click chart to enlarge; SPX, SPY):

sp500-index-spx-market-timing-chart-2017-12-01-close

SP500 Index stretched above the channel still.

Survey Says!  Sentiment of individual investors (AAII.com) showed a Bull minus Bear percentage spread of  +4.33% vs. +6.48% vs. last week.  It barely moved despite the markets reaching all time highs.  Plenty of room to go, but as I said above, due to the stretch right now, further consolidation (a sideways move) may be required at a minimum, if not more backtesting.

Thurs. 12 am close to poll Bulls               35.95% Neutrals 32.43% Bears      31.62%

2.  U.S. Small Caps: If you don’t think there are dip buyers, take a look at the Russell 2000 market timing record this week!  The recovery from the swoon was breathtakingly fast – note the BIG RED LINE for Friday’s price range in the chart.  IWM still closed -0.41% for the day, but was little changed compared to the earlier damage from the Flynn plea bargain.  The small caps will inherently carry more risk (beta) in a pullback if we see one, but they are not particularly stretched on a longer term time frame.  Still, it’s best to buy pullbacks like Friday’s, even if the future drops are less generous.

Russell 2000 U.S. Small Cap Index  (click chart to enlarge; IWM, RUT):

iwm-russell-2000-etf-market-timing-chart-2017-12-01-close

The bounce back was fierce.

3. Gold: Gold is following interest rates even more than the US dollar over the short term here.  My market timing trigger is still in play as we’re close to that orange line.  Gold is going to show its hand soon, so trade in the direction of the move.  The Bullish view is based on TrumpFlation; the Bearish view is based on economic growth with low inflation.

Gold ETF (click chart to enlarge the chart; GLD):

gld-gold-etf-market-timing-chart-2017-12-01-close

Gold in holding pattern. Trade the direction of the move.

4. U.S. 10 Year Treasury Note Yield (TNX): I said last week: “I’m watching the 2.304% market timing level and do not want to see the 10 Year Yield fall below there.”   The swoon of stock selling/Treasury buying took the yield back to 2.315% but the close was 2.362%.  I see higher rates coming as TrumpFlation is all but certain due to wage pressures, and the tax plan will be somewhat stimulative to GDP.

I am an independent as many of you know.  That does not prevent me from seeing the impact of the GOP Tax Plan.  The Tax Policy Center says the Trump/GOP Plan will create 0.7% more GDP growth in 2018 and fall from there.  Employment is “full,” and the issue is not the number of jobs as I’ve said here before; it’s that those looking for jobs lack the necessary training to fill the vacancies.

Who gets screwed by the Tax Bill?  The biggest tax increases by 2025 (this is considered the best true sample year, before the expiration of any of the individual tax cuts) will be seen for about 20-25% of those making between $91,700 -$308,900 per year. Only 4.4-6.9% of those making less than $53,900 will have an average tax increase of $400-810.  I am guessing that the biggest losers are mostly concentrated in the states with high state and local property taxes due to the limitation on those deductions to $10,000.  Review the details in the 2025 Chart HERE.

Remember when reading the press on the Tax Bill that if you look at the numbers AFTER the individual cuts go away, the results are very different and very bad.  It’s not the intent of the GOP to not deal with this later.

Here are my 2018 and 2020 predictions: Since 74.1% of US families will get a tax cut, the negative reaction seen now may dissipate when the actual results are seen by this super-majority.  Those hurt the most other than the upper middle class will be the poor who lose Medicaid coverage, but they don’t vote as much as wealthier people do.  The other group hurt will be in states Trump LOST in the 2016 election, so it won’t impact him in 2020.  In fact, he may do better if the Flynn thing does not blow up in his face (completely unknown at this point regardless of what anyone says; only Mueller knows what he’s really got).

But here’s the rub for Trump and it will cost him countless tweeting hours: the GOP will lose enough seats in the 2018 elections to cause the Democrats to take over the Senate and/or the House.  It only takes three Dems to shift the balance of power in the Senate because they have 48 seats and Pence is the tie breaker for 50:50 ties.  Trump will be entirely dependent on Democrats to get anything else done following the 2018 elections.  Obama had the same problem of gridlock.

Whether Trump wins or loses in 2020 will depend on the state of the economy and healthcare, which are the two top priorities of voters, and on the energy of the Democratic Party.  The occurrence or non-occurrence of a major US terror event may also play some role, but unless BIG, it will be secondary.  It will be much harder for Trump to win with his current lean 30% base.   The Tax Cuts are not big enough to change enough votes by themselves, and the Democrats will be fiercely energized in their hatred of him.  They will work much, much harder than Hillary, who tried to coast to a win, while Trump kept plugging day after day after day.  Persistence pays dividends, even for sex scandal stained candidates like Trump.

U.S. 10 Year Treasury Note Yield (click chart to enlarge; TNX, IEF, TYX,TLT,TBF):

tnx-10-year-treasury-note-market-timing-chart-2017-12-01-close

Treasuries still moving in a range.

Now, as usual, we need to review our three market timing signals (below the chart after you review it…)

Let’s review the three market timing signals together….

MY SIGNAL SUMMARY for a Further U.S. Stock Market Rally:

Stock Signal ON (Small Caps above “Trigger Line”).  I expect further upside.

Gold Signal ON (GLD is slightly below the “Trigger line” which is negative for gold, and better for stocks.  My reasons are above, but remember to trade the direction of the next move, if you are a trader. Investors should consider gold “currency insurance” and consider some bitcoin as an additional small % hedge perhaps.  Know that bitcoin could go to zero, just as stocks can.  Gold can also experience huge drawdowns.

Rate Signal ON (10 Year Yield above the “Trigger Line,” good for stocks, not bonds).  I’ve set my line in the sand for a pullback that is healthy.  See above.

Thank you for reading.  Would you please leave your comments below where it says “Leave a Reply”… or ask a question…  Pay it forward too by sending the link to MarketTiming.Blog (that link will immediately connect them to this webpage) to a relative or friend.  Thanks for doing that.

Note: My monthly newsletter is now CLOSED to new subscriptions until late this year.  I’ll let you know here if and when it reopens.

Be sure to visit the website for more general investing knowledge at:

Sun and Storm Investing™

Standard Disclaimer: It’s your money and your decision as to how to invest it.

I thank Worden Brothers for the charting system I use to post these charts.  If you want to know more about the charting system I use every day, go to my “Other Resources” page here:  Other Resources   It makes it much easier to follow along with me if you can see the charts and manipulate them on your own computer.  It’s a great investment to have an excellent charting system.  Check it out with a free trial at the link above.

Copyright © 2017 By Wall Street Sun and Storm Report, LLC All rights reserved.

Posted in Bonds, Cryptocurrency, gold, investment, investor sentiment, large cap stocks, S&P 500 Index, small cap stocks, Treasuries | Tagged , , , , , , , , , , , , , , , , | Leave a comment

Market Timing Brief™ for the 11-24-2017 Close (11-29-2017 Bitcoin Update): Will the Market Fall on Weak Q1 2018 Tech Earnings Comparisons? Gold in Holding Pattern. Rates Still Making Higher Lows. Bitcoin Price is Now Stretched.

A Market Timing Report based on the 11-24-2017 Close, published Sunday, November 26th, 2017

I deliver focused comments on market timing once or twice a week.  These are supplemented with daily “Tweets/StockTwits” (see links below).

UPDATE 11-29-2017: Bitcoin Defying Trend Channel on Run Above $10,000

It is what it is.  Sometimes markets that are stretched become even more stretched.  If you must buy now to “get into the market,” then buy higher and lower in a methodical way.  There is inherent risk in  buying a stretched market.  It can snap back based on the next “negative news,” which is often simply an excuse for a market correction.  Compare this chart to where we were just last Saturday (chart #5 below).

BTC-bitcoin-market-timing-chart-2017-11-29-918am

Bitcoin defying the channel on panic buying above $10,000.

Now back to this week’s issue…

1.  SP500 Index: We need to pay close attention to year over year quarterly earnings comparisons for the tech sector going into 2018.  Market timing signals may start going off in techland by Q1 of 2018 and I’ll explain why…

Why should we track this closely?  First the facts.  The last quarter (Q3) revisions of earnings growth in the tech sector according to FactSet (link opens the PDF) went from 8.8% to 19.9% due to upward revisions to earnings estimates and upside earnings surprisesBy comparison, FactSet says with 98% of companies reporting, SP500 Index earnings rose a much lower 6.2% in the quarter. Still very good, but tech earnings were far better.

Great is great, but remember that stock prices are sustained by continued earnings, but propelled upward by earnings GROWTH, not the level of earnings.  A constant E deserves a constant P, at least over time.  The market can always get far ahead of earnings growth, but if growth in tech earnings slows into 2018, the comparisons become tough and tech stock prices could come down. 

Here however is the tricky part: What if tech earnings growth slows from 20% to 10% for all of 2018?  That would still allow a gradual rise in tech stock prices.

However, seeing earnings growth rates slide for Q1 could raise investor fears that the slide will turn to the negative, with an earnings recession, even if it does not come until 2019 or later.  This means opportunities may arise for us to buy tech stocks sold off in fear of earnings growth deceleration as our market timing signals fire off.  

When will our first market timing buying opportunity arise in tech stocks?  First, you may still be able to make gains between now and the first whiff of tech earnings growth deceleration.  The risk to those gains will require using profit based mental stops to be sure you preserve a certain profit level on all new tech trades from now to the first sign of “trouble.”

My first choice scenario: The market tries to discount “earnings growth slowing” in tech ahead of time after Q4 2017 earnings based on projections of slower growth in the January earnings reports.  If those reports are above current expectations, the selling could wait until after Q1 2018 earnings in April.

My second choice scenario: The first selling panic on tech earnings growth deceleration could come when earnings are actually released for Q1 2018 in April, when the earnings deceleration is actually confirmed, and particularly if the projections are softer for Q2 2018 and beyond than they are now.  As said, a continuing deceleration will raise the possibility of a tech earnings recession.

Generally, the stock market discounts events early, which is why I’m going with Scenario 1 for now.   “For now” means we need to monitor expectations for tech earnings growth and watch the direction and magnitude of revisions.

The still continued growth of tech earnings, even if halved to 10% into 2018 will allow tech stock prices to rise following the bouts of selling. 

If worse than 5-10% earnings growth, a tech pullback will be far more likely.

Read on though to the biggest current market threat…

First, Fed news for the week…  The Federal Reserve minutes released this week revealed the conflicting feelings from one Fed member to another and even of individual Fed members, including Dr. Yellen.  She wants to raise rates in December as the entire Fed does supposedly, and the CME stats verify the likelihood, but is not sure deflationary pressures are behind us. It is of note that the probability of the Fed Funds Rate being hiked from 1.0-1.25% to 1.25-1.50% is now 91.5% down from 96.7%.

Meanwhile inflation has picked up and even the “transitory inflation” as the Fed considers it, of oil prices is on the upswing as oil makes one new high after another. Oil closed this past week at 58.97 after dipping briefly to retest the $55 area of the prior breakout, a classic market timing move.

I will add back exposure to oil stocks when my signals go green.  I can tell you that some investment firms bought into the oil uptrend early via volatile oil stocks and are now carrying sizeable losses, so I want to demand price strength, before beginning to buy the pullbacks in the stocks.  Oil supply looms over the market and will until China’s and India’s demand (plus “other”) pressures prices upward.  There is also an electricity demand from advancing technology.  Connectivity requires electricity, which requires energy resources.

There is a two sided sharp blade here for Fed tightening. First, if the Fed raises rates now, it could cause the economy to decelerate and bring back deflationary pressures.  If it fails to raise rates and the GOP gets its way with its tax plan, that could create inflation and push the Fed to raise rates and slow the economy.  Yes, inflation could result through this mechanism in economic slowing, or at least a bust after a rush of Trump/GOP tax-cut induced artificial growth.  It’s artificial because it’s based on funny money we don’t have to spend.

The biggest risk to tech stock and all stock prices now is failure of the GOP Tax Plan to pass as delineated HEREThat bill including repatriation of mucho dollars by large cap US companies at a low tax rate is built into current market prices.  So are the corporate and individual tax cuts.

Any signs of softness in the US economic numbers from this week?  Yes, somewhat, in the PMI numbers from Markit, which showed a slight slowing in the composite number (services and manufacturing) at 54.7 in November vs. 55.3 in October.  The chart shows a topping out, which must be negated by a new high as seen HEREI’ll be watching for early signs of economic slowing, which could easily be forestalled by the Trump/GOP tax plan funny money.  

Keep up-to-date during the week at Twitter and StockTwits (links below), where a combined 32,475 people are joining in…

Twitter® Follow Me on Twitter®.  Follow Me on StockTwits®.

SP500 Large Cap Index (click chart to enlarge; SPX, SPY):

sp500-index-spx-market-timing-chart-2017-11-24-close

Brand new breakout high.

Survey Says!  Sentiment of individual investors (AAII.com) showed a Bull minus Bear percentage spread of  +6.48% vs. -5.87% last week or somewhat more Bullish, but not stretched to an extreme.  The market was good for a bounce that took it to new all time highs.  Sentiment is still not at all stretched.  Remember that the press focuses on newsletter writer and institutional sentiment.  The individual investor is just getting warmed up to this Bull market.  There are risks, yes, but it is not over.

Thurs. 12 am close to poll Bulls               35.49% Neutrals 35.49% Bears      29.01%

2.  U.S. Small Caps: Last week I said, “IF there is a rate breakout this next week, early in the week, I believe small caps will rally further and at least test the prior high.”  Rates were relatively flat and despite that small caps hit a new high, but barely. In any case, small caps have broken the market timing flag to the upside.  We’ll see if it can hold what amount to two days of gains.  If the overall stock market rally is still “real,” small caps will continue to make new highs.

Russell 2000 U.S. Small Cap Index  (click chart to enlarge; IWM, RUT):

iwm-russell-2000-etf-market-timing-chart-2017-11-24-close

Small caps make it over the prior high.

3. Gold: Gold is holding up due to U.S. dollar weakness despite the 10 Year Treasury hanging on above its “Trigger Line.”  The trajectory of the economy and interest rates as they effect the U.S. dollar will define gold’s next market timing move.  For now, there is a rough triangle forming on the daily chart below (lower highs, higher lows) and gold will resolve from this pivot.  Follow the direction of the move out of this triangle, up or down, if you are trading.  I am only looking at the lower triangle whose top is formed by the intraday highs of 10-16 and 11-17-2017.  The base of that triangle is the yellow trend line.

Gold ETF (click chart to enlarge the chart; GLD):

gld-gold-etf-market-timing-chart-2017-11-24-close

Gold still lingering below the “Trigger Line.”

4. U.S. 10 Year Treasury Note Yield (TNX): What’s the danger in the 10 Year Treasury Yield chart?  The head and shoulders market timing formation could break down.  I’m watching the 2.304% level and do not want to see the 10 Year Yield fall below there.    It is the 11-07-2107 low.  If it does, it means something is off in the recovery process or with the Trump/GOP tax-cut plan.  It means that economic slowing is expected.  It could mean that any further Federal Reserve rate hikes are perceived as possibly dampening the economic recovery and leading to disinflation.

U.S. 10 Year Treasury Note Yield (click chart to enlarge; TNX, IEF, TYX,TLT,TBF):

tnx-10-year-treasury-note-market-timing-chart-2017-11-24-close

Rates holding up with slightly higher highs but with an emerging head and shoulders pattern.

5. Bitcoin: I will report at times on some of the market timing extremes in the charts, which may represent buying or selling opportunities.  The trend is up, so we are looking for buying opportunities more than selling, unless you are an active trader.  This is one place you may not want to add exposure as we are very stretched, even beyond the upper channel line as the market timing chart shows.

Now, as usual, we need to review our three market timing signals (below the chart after you review it…)

BTC-bitcoin-market-timing-chart-2017-11-26-1133am

Stretched above the upper channel line.

Let’s review the three market timing signals together….

MY SIGNAL SUMMARY for a Further U.S. Stock Market Rally:

Stock Signal ON (Small Caps above “Trigger Line”), but now the rally to new highs must be sustained.

Gold Signal OFF (GLD is slightly below the “Trigger line” which is negative for gold, and better for stocks.  Gold prices continue to hinge on economic strength vs. inflation.  The stronger the U.S. economy without significant inflation, the higher rates will go as gold declines.  Besides economic weakening, inflation would be the other out for gold.

Rate Signal ON (10 Year Yield above the “Trigger Line,” good for stocks, not bonds).  Rates were oscillating up and down this week.  We’ll continue to look for even higher interest rates or the recovery comes into question.

Thank you for reading.  Would you please leave your comments below where it says “Leave a Reply”… or ask a question…  Pay it forward too by sending the link to MarketTiming.Blog (that link will immediately connect them to this webpage) to a relative or friend.  Thanks for doing that.

Note: My monthly newsletter is now CLOSED to new subscriptions until late this year.  I’ll let you know here if and when it reopens.

Be sure to visit the website for more general investing knowledge at:

Sun and Storm Investing™

Standard Disclaimer: It’s your money and your decision as to how to invest it.

I thank Worden Brothers for the charting system I use to post these charts.  If you want to know more about the charting system I use every day, go to my “Other Resources” page here:  Other Resources   It makes it much easier to follow along with me if you can see the charts and manipulate them on your own computer.  It’s a great investment to have an excellent charting system.  Check it out with a free trial at the link above.

Copyright © 2017 By Wall Street Sun and Storm Report, LLC All rights reserved.

Posted in Bonds, Cryptocurrency, gold, investment, investor sentiment, large cap stocks, S&P 500 Index, small cap stocks, Treasuries | Tagged , , , , , , , , , , , , , , , , , | Leave a comment