A Market Timing Report based on the 12-28-2018 Close, published Sunday, December 30th, 2018…
I deliver focused comments on market timing once a week. These are supplemented with daily “Tweets/StockTwits” (see links below) and comments in the “markettiming” room on StockTwits.
1. SP500 Index Market Timing (S&P 500 Index®; SPY, SPX):
I’ve covered the large number of issues facing the market over the past few weeks (last week’s update with the details is HERE).
#1 Retail Q4…Looking good.
#2 China Trade War…At least #Trump and company have stopped their contradictory blabbing, but there’s been no clear progress.
#3. Rates…Could be trouble this week if rates move AT ALL lower (with stocks moving DOWN with rates. BOTH moving down together would mean trouble.).
#4. Global Economic Slowdown…Still trouble for the market and could definitely get worse. I’ll be following economic updates like a hawk. You should do the same. Goldman Sachs per CNBC says they have lowered their GDP forecast for H1 (first half of 2019) from 2.4% to 2.0% or a 16.67% drop in their forecast. They further expect H2 2019 GDP to “slow to a virtual crawl below 2%,” which sounds close to zero to me. They are “still not particularly worried about a recession.” Until they are!
Think about that GDP downgrade. Say Company X comes out Monday and says “Our revenues will be 16.7% lower than expected in H1 2019.” Imagine what that stock would do. Slowing can snowball and beget more slowing.
#5. Oil Price Collapse…Still potential trouble despite the recent bounce.
#6. Tech Bear Market…XLK is above the Feb. low, a positive. Moving back below would mean danger to the entire rally as Big Tech was a big part of the bounce (plus AMZN but that is still XLY based). The return to Tech buying so soon is not a great sign that all the gains will hold without a retest of the lows at a minimum. If Tech keeps moving up, however, that may mean the market is gaining confidence around an economic turn 6 months out.
#7. Trump Impeachment/Trial Risk…Still a big risk (short to intermediate term risk, not a long term risk; the market does not care about who the President is ultimately, but does care what the policies are), though no casual swipes at the President will be taken with the market’s already down so severely. They will at least think twice.
#8. Government Shutdown…Does not matter except for for short term trading, but if it messes up Q1 GDP (goes on more than 2 weeks as a very rough estimate), that could hurt markets over the short term.
Now let’s check in on two “Canary Signals” we’ve been following:
“Intel-igent Market Timing Signal” (Intel; INTC): Negative, but improved. Attempting recovery, but I’d call the close back below a test of the 50 day moving average (mav) as negative. Back above prior down channel. You will likely need to trade semis, not hold them, until the economy accelerates again.
Only a rise above 50.60 would change the current picture of a down trend since the June high. (Reminder: INTC was/is our “tell” on 2nd half earnings in tech as noted HERE.)
Bank of America (BAC) Market Timing Signal: Negative, though it bounced over 7%. This is a “Bounce in a Bear Market” for now. The stock could move either up or down from here. It is in the middle of the down channel on the daily chart starting in Feb.
Last week I pointed out that December breakdowns like the current one have been unheard of at least going back as far as 1970. I was looking for a specific technical pattern of market collapse, which is why I limited the time span of analysis.
It was reported at least prior to the bounce this week this December would be known as the worst December ever for the stock market. That says a lot! What it says to me is “this is not over.”
We are already in what I call a “Mini Bear Market” as defined by my “New Rules” for Bear market names HERE.
I expect a retest and even a failure at the recent low, although there is no guarantee of that. It could occur with even weaker earnings data and weaker projections coming in by January, and drive the SP500 Index to my “Big Red Wave” target or below (recently updated HERE).
I reviewed all the Bear market declines (not including Mini Bears of between 15-20%, only those over 20% as this one has been), since World War II and found that (as I’ve been saying and as the press has started to say just this past week) IF we are not headed into a recession, or if the recession is both relatively shallow and brief, the downturn could already be over. As you’ll see below, that’s a shaky “could.” This is why any buying must be in stages and NOT all at once in my view.
The best case of a shallow recession was 1990, in which there was a mild, brief recession and a 20.36% market decline with a rapid recovery to new highs in 1991 in a rally that ran all the way to 1994, before the first bump lower. There was a 1.4% drop in GDP at that time (Ref) vs. a 5.1% drop in the Great Recession beginning in Dec. 2007 and ending 1.5 years later.
But note there was a recession in 1960-61 with a similar 1.6% drop in GDP that took the market down about 28% from its prior peak, and the shallow recession (0.6% drop in GDP) of 1969-70 lasting just 11 months brought the stock market down 36% from its peak.
Even without a recession, we could see another discount of 10% to a total pullback off the highs of 30%ish, given unresolved negative catalysts that linger (several noted on the list above would suffice, such as impeachment, 25% tariffs on China, or a March hike by the Fed could even do it). You can review the dates of all post-WWII drawdowns and the percentages HERE.
In 1987, in which I exited the market partly in the middle of Sept. before Black Monday as well as executing a final sell on the Friday before Black Monday (-22.6% decline in one day, the worst in history), when I took my last dime out, the market went down 31% from the prior peak despite the lack a of economic recession. It was attributed to both the sense that the market had run up quite a bit already and trading program disasters that were subsequently addressed by adding some regulations to slow the swings down. Recall that the market tanked in February based on the impact of computer trading programs and VIX derivatives. We’ve also had two Flash Crashes in 2010 and 2015 with no permanent fix in place in my view.
IF we are headed into a deeper recession, you can expect damage of up to roughly 50% off the highs (it was 57% in the Great Recession for the SP500 Index). Given the uncertainties right now, I like my exposure level (see social media links). Note, however, that if the bottom is already in, my exposure is too low at the moment, and I’ll have to add on the way back up.
On the other hand, I have plenty of cash to deploy if things go from “slow” to worse for the economy. I will add exposure on pullbacks and will add higher if needed, mostly before I hit my prior selling points. My prior exits were mostly higher, so there is still room to add back exposure (See my page on “Passive Shorting” if you haven’t). I coined the term to help investors consider it as a way to navigate pullbacks and increase returns.
If you have remained frozen to this point, I would only “sell some,” on an overextended bounce, unless we break to a new lower level. Then you could “sell some” lower, but slowly, because you must be willing to increase exposure on a reversal or you will fall behind the market. The goal is to beat the market by a few percent or more. Even a 2% improvement on SP500 Index performance is worth it. Do the math on that, and you’ll see that it will make a big difference in your retirement. I’ll give you one example, and you can do your own calculations…
A 45 year old who starts with $100,000 invested and adds nothing (very unlikely, but let’s keep it simple), at a 6% total return ends up at age 65 with $325,000 at age 65 vs. $466,000 at an 8% total return. The gains are $225,000 vs. $366,000 or an additional 63% for the 8% return. Realize these numbers do not include the impact of the average 2% inflation the Fed shoots for in the PCE Inflation Index, which may underestimate inflation. Every extra percent return matters! Check your own numbers using this calculator (I have not verified its accuracy): HERE.
Remember when you take off exposure higher, and the market moves lower and you add back, the gain back to even is greater than the percent loss from the top. A 50% decline in the market means you make 100% on the bounce back to even. Buying a 50% decline means you are locking in the potential for 100% gains, even if it takes a few years to get back to even. How many years this takes is the catch of course, and that determines your annual return.
Over the very short term, Monday could be messy as procrastinators may still harvest their tax losses going into Monday’s close. That alone could result in another retest of the lows. On Thursday I correctly predicted the market could retrace about half of its gains off the 12-26 intraday low and it did and proceeded to rally to a higher high.
Have a plan for the levels you will add exposure at either higher or lower and be willing to change your plan if and when things change…and they always do change eventually.
We know right now that if there is no recession, things are going to get better, even if they deteriorate more from here, and as the data improves, the market will begin a new up trend. That’s what the data says right now. If that changes, we must change our minds. The biggest mistake investors make is not being flexible and changing with the markets and economic data.
Read my prediction from last week about a shutdown reversal and how to trade it. It could save and/or make you money!
Keep up-to-date during the week at Twitter and StockTwits (links below) where a combined 33,802 investors are following the markets with me…
Follow Me on Twitter® Follow Me on StockTwits®.
Join the Conversation in the StockTwits “markettiming” Room
The room link above is for serious market timers, but if you need to learn and catch up, you will likely learn a lot there too. 😉
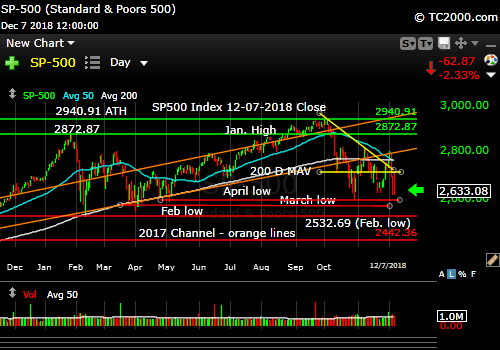
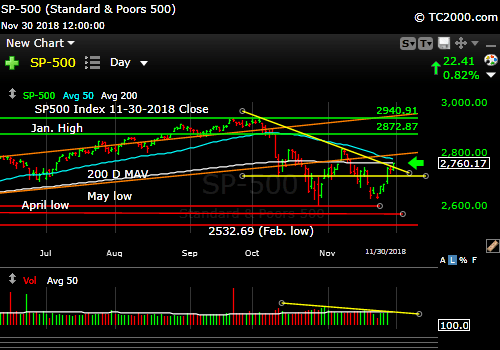
You’ll note in the chart below that the SP500 Index bounce this week came very close to the February low and then turned down. That by itself is a negative. Moving back above the Feb. low on strong buying is a key move the SP500 Index has to complete to turn this bounce into a 1X bounce into a 2X or more bounce. XLK (Tech Sector of SPX) did rise above that Feb. low breakdown level, but not by much. If you see XLK failing on Monday, it could spell bad news for the Bulls. On the other hand, if the XLK rally simply continues, it could auger good things for January at least.
SP500 Large Cap Index (click chart to enlarge; SPX, SPY):
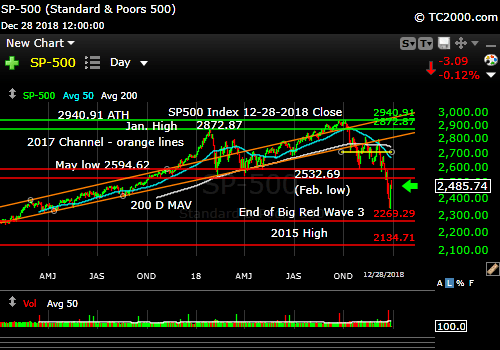
Bouncing in a Bear Market.
Survey Says! Sentiment of individual investors (AAII.com) showed a Bull minus Bear percentage spread of -18.75% vs. -22.44% the prior week. The poll ended Weds. night and there are too many Bulls still. Sentiment suggests the bottoming process is not complete or the bottom has still not been reached. I would ask, “How can the market bottom without truly negative sentiment numbers given this is one of the worst Decembers ever?” You can read my comment in my StockTwits markettiming room HERE.
| AAII.Com Individual Investor Sentiment Poll | ||
| Bulls | Neutrals | Bears |
| 31.55% | 18.15% | 50.30% |
| Thurs. 12 am CT close to poll | ||
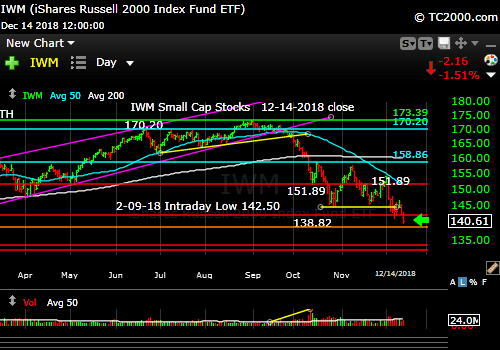
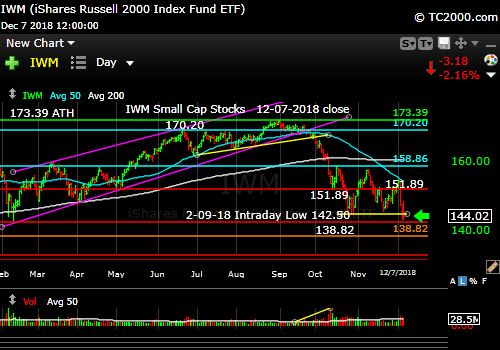
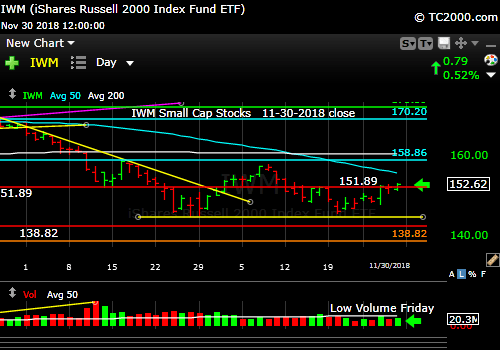
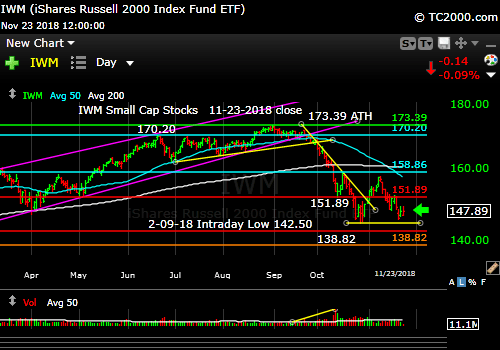
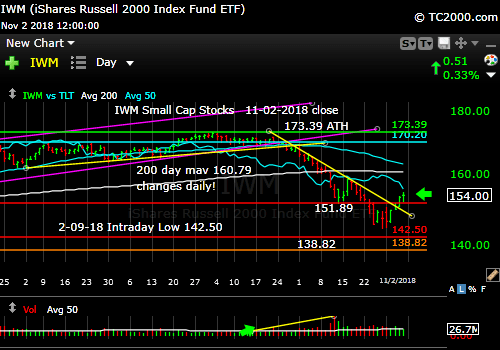
2. U.S. Small Caps Market Timing (IWM): Not a good place to be until signs of U.S. economic acceleration appear or are anticipated. Still far below the February low and below that orange line which was the second breakout to higher highs after the first post-2016 Election bounce.
Russell 2000 U.S. Small Cap Index (click chart to enlarge; IWM, RUT):

Still miles below the Feb. low.
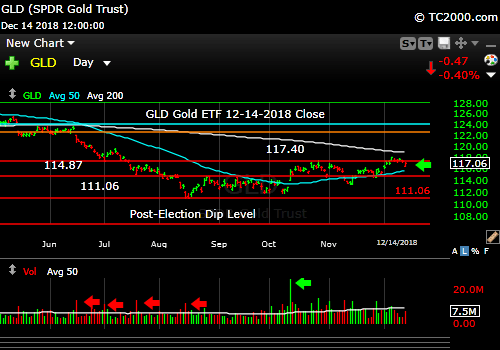
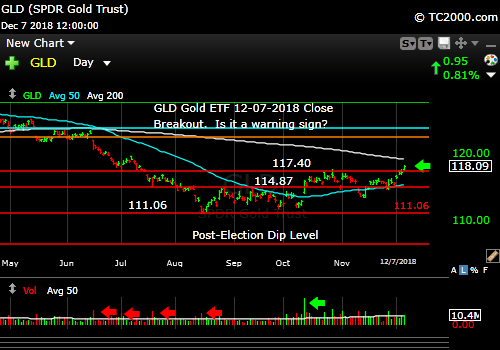
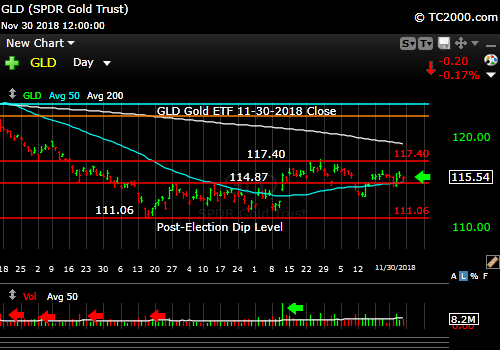
3. Gold Market Timing (GLD): Last week I said: “A trading add on pullbacks.” The risk to gold is that interest rates rise somewhat from here and stocks continue their rally higher. Note GLD pulled back during the big 5% SP500 rally on Weds. and then rose as the rally slowed its advance.
The Gold ETF (click chart to enlarge the chart; GLD):
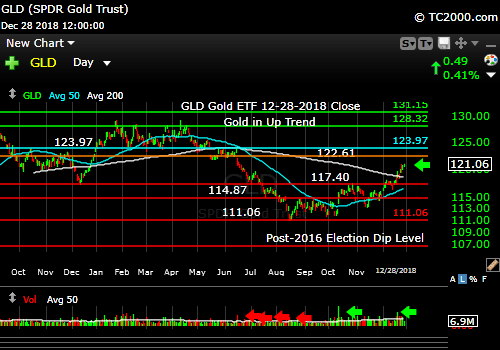
Gold moves up, but won’t continue up if rates rise from here.
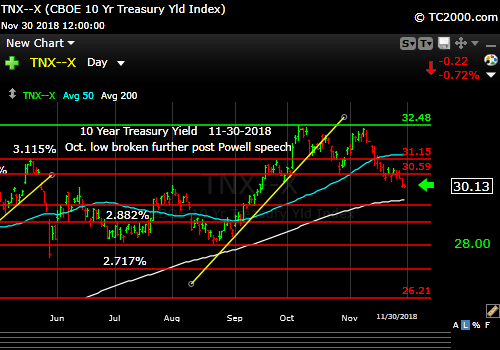
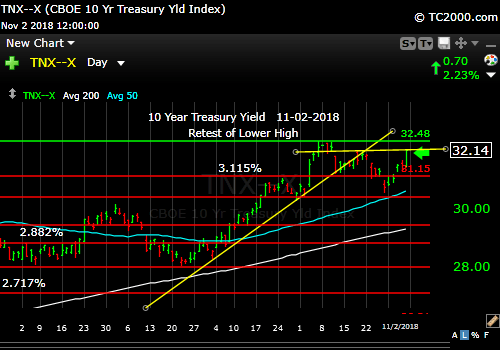
4. Interest Rate Market Timing – U.S. 10 Year Treasury Note Yield (TNX):
Still true from last week: “T*N*X 2.808% is the key level to watch for a reversal back UP.” (the *’s are there so bots cannot read my targets)
On an immediate basis, rates falling to new lows below the Friday close would spell trouble for the stock market rally, but I will be watching the simultaneous performance of stocks to interpret the meaning of the rate change. If stocks sell off with rates moving down further, it would mean risk ON was back to OFF again.
UPDATE 12-31-18: If rates fall slowly with stocks rising, that would mean the market feels the Fed will come it’s way and go slower on rate hikes and eventually reverse course. T*N*X 2.717% is the last low of importance. Watch what stocks do if that is breached and you’ll know what it portends, because the move already in motion will accelerate. If stocks are falling as rates fall, they will keep falling.
Back to Sunday’s issue….
It’s not clear which way this will go, as rates got very close to my upside reversal number on Weds., but did not close above it. Watch the 10 Year Yield closely for what I said in the room on Friday could mean “death to the current bounce.” My number noted in the room has been “marked” by the market as I like to say. Exactly in fact! It closed Friday exactly at the key number (noted in the same “room note” with the link in the “Sentiment” section above).
Check out the “Market Signal Summary” below – after you review the following chart…
U.S. 10 Year Treasury Note Yield (click chart to enlarge; TNX, IEF, TYX, TLT, TBF):
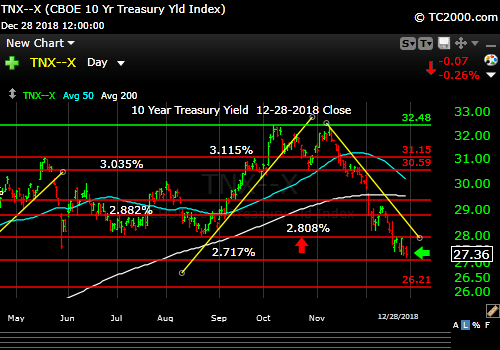
If stocks are to continue higher, rates should not move down further on an immediate basis.
Now let’s review three key market timing signals together….
Do not use these signals as a trading plan. They are rough guidelines. I currently share my own moves on social media (links above).
MY MARKET SIGNAL AND TREND SUMMARY for a Further U.S. Stock Market Rally with Real GDP Growth (“Real” means above inflation):
Stock Signal RED for a further U.S. stock market rally with a BEARISH SP500 Index trend. (signal here is based on small caps) There is just a bounce in a down trend thus far. There is nothing technically that is terribly reassuring.
The V*IX (which relates to SPX volatility) closed at 28.34 which is still very Bearish. It closed at 30.11 the prior week. The V*IX did reclaim 28.84, which is positive, but must keep falling.
From prior week and other back issues: Further V*IX Bull Targets: 25.94, 23.81, 20.34, 18.18 to 18.10, 17.24, 16.86, and 15.95 to create a new recent low. The ‘Bull Nirvana Target’ is our V*IX # of the Year: 13.31.”
Six weeks ago I said: “The Bears need to take out the 26ish top that was tested once again this week for the market to go into another leg of decline.”
I said previously: “As before, VIX 28.84 is the Bear target for Armageddon (another big chunk of losses driving SPX down significantly lower). Just moving above 26 could do it however.”
Gold Signal RED for a further U.S. stock market rally with a BULLISH Gold Trend. A further rally will be subject to interest rates, which will impact the U.S. Dollar. See GLD section above.
From before: “Remember GLD is being used as an indicator for the ECONOMY here.”
Rate Signal RED for a further stock market rally with a BEARISH 10 Year Yield Trend. I said 2 weeks ago, “Watch the oil price too. Higher oil tends to mean higher rates.”
As for much higher rates and their possible impact, I said previously: “All heck would break loose for equities if TNX lurches above 3.248%, particularly if the rise is rapid. Buy long dated Treasuries as close as you can to 3.248% on the 10 Year Yield TNX (IEF, TLT, etc.).”
I previously warned about the Fed tightening process: “This level of the 10 Year Treasury Yield, which is too high for current conditions as explained HERE, will eventually slow the economy.”
Sept. 28th issue: “A rapid push higher in rates would mean trouble for stocks, as occurred in early 2018. That’s what I call ‘Rate Shock.'” The period of rising rates in early October was #RateShockII as I called it.
Thank you for reading. Would you please leave your comments below where it says “Leave a Reply”… or ask a question or report a typo…
Pay it forward by sending the link to MarketTiming.Blog (that link will immediately connect them to this webpage) to a relative or friend. Thanks for doing that.
Be sure to visit the website for more general investing knowledge at:
Standard Disclaimer: It’s your money and your decision as to how to invest it.
I thank Worden Brothers for the charting system I use to post these charts. If you want to know more about the charting system I use every day, go HERE. It makes it much easier to follow along with me if you can see the charts and manipulate them on your own computer. It’s a great investment to have an excellent charting system. Check it out with a free trial at the link above. I am an affiliate of Worden Brothers, though oddly I’ve never been paid a cent by them. If you HAVE subscribed to their service, please send me a message. 😉
Note: I’ve updated my criteria for the equity signal for a further U.S. stock market rally to the following: GREEN = Bullish, YELLOW = Neutral, RED = Bearish. In other words, the colors tell you whether the signal supports the stock rally or not, while the Bullish, Neutral, and Bearish designations are about the trend.
A BEARISH trend signal does not mean we should not buy. A BULLISH trend signal does not mean you cannot sell some exposure. It depends on what is going on in the economy and how oversold/overbought the market is at a given point whether the Bearish signal is to be sold, sold on the next bounce, etc. and whether a Bullish signal is to be bought or if profits should be taken. A NEUTRAL trend signal does not mean the end of the Bull or Bear. It means to wait and look for possible subsequent entry points within the existing trend, Bull or Bear, but preserve capital if the entry fails. Our strong intention is to buy low and sell high. By the way, I will keep showing the prior orange “Trigger lines” in the charts for now as reference points only; they have historical value for us from the post-2016 election period.
Copyright © 2018 By Wall Street Sun and Storm Report, LLC All rights reserved.