A Market Timing Report based on the 10-26-2018 Close, published Saturday, October 27th, 2018…
I deliver focused comments on market timing once or twice a week. These are supplemented with daily “Tweets/StockTwits” (see links below).
1. SP500 Index Market Timing (S&P 500 Index®; SPY, SPX):
Last week I asked, “WILL THE 2017 CHANNEL and 200 DAY MAV HOLD AGAIN THIS TIME?”
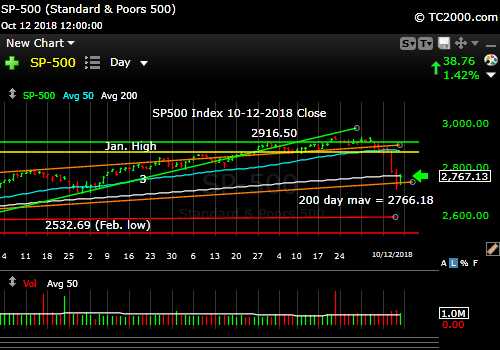
Neither did. I also said: “If ‘it’ holds, what will hold is NOT the 200 day in my view, or even the slightly lower 2017 channel line, but the low set intraday on 10-11” which was 2710.51. On Tuesday it appeared it could hold, but on Wednesday the 24th, Master Market, as I call the emotional 5 year old, became even more volatile, falling below that target to a spot just above the May low.
The central reason the market is heading lower is because of the weak earnings and revenues expected for the SP500 Index companies in Q4 2018 to some extent, then accelerating into Q1 and Q2 of 2019. I went back to see when I first wrote about this, and it was in the 7-20-18 issue HERE. The data is updated for this week on the FactSet PDF which will open HERE. Weeks ago, I covered the fact of US growth slowing due to an “infection” from foreign sources. This data alone is the central risk now. Tariffs are providing some pressure on corporate earnings in Trump’s self-inflicted wound. It would have been better to negotiate this more quickly to avoid inflationary pressure of this kind, although yields are moving DOWN not up at the present time. I’ll get to more on rates later.
To be fair, the technological theft issue in China cannot be overlooked as we seek to do more and more business both in China and as we allow more Chinese investment in the U.S. We are not privy to the negotiations, so it’s impossible to say whether Trump is being appropriately stubborn or too stubborn. The Chinese clearly have the will to wait him out, particularly until after he is weakened in the midterm elections by having the Democrats likely take the House, while the GOP keeps the Senate. In the larger scheme of things, the trade issues will be worked out before the SP500 Index is down 25% in my view! Great consolation I know. Send a little Twitter note to our Tweeter-In-Chief to urge him to wrap up the trade war.
Last week I asked: What favors the SP500 Index breaking (at least in time) in a significant way?
1. I made the point about E and Rev slowing into 2019 and said I thought the Feb. low would be the next target if the 200 day moving average and 2017 up channel lines (orange lines) failed to hold.
2. I also said “investor sentiment (AAII reviewed for this week below) did not reach any sort of wash out level. In fact, as I said last week, investors were complacent on 10-10-18, after a very big down day of 3.29%. ”
Sentiment is just one thing I look at, but expecting a bigger fear spike is reasonable. See my review of this week’s data below…
3. The 3rd reason for trouble: “A surprise run by oil much higher, with an associated spike in rates to a new high. Inflation and oil spikes move together despite what the Fed may say. ” This is not happening. Oil is falling in price despite the Iran sanctions and the Saudi killing of an American resident reporter, but we should keep an eye on it.
4. The 4th reason for a bad break: “A rate spike of the 10 Year Treasury Yield above 3.248% (without the oil spike) for ANY REASON would induce a further leg down in the SP500 Index and in mid caps and small caps as well of course.”
This is not happening, at least for now. If wage inflation is too hot in the Monday BEA Personal Income and Outlays Report at 8:30 am ET (where the PCE Inflation Index number the Fed follows is revealed) OR in the jobs report next Friday, Nov. 2nd, the 10 Year Yield could spike up one more time, before turning back down. Any surprise move to a new high would be unwelcome.
5. The fifth reason for a further market meltdown: “A bad break in the small and mid caps to new lows leading the SP500 Index down.”
This is what happened, perhaps due to reason number one above, but remember valuation is always relative, so stocks that had not sold off like Amazon, were becoming vulnerable. In drawdowns, first they shoot the easy targets with the worst prospects and small capitalizations. Then they shoot the generals. Amazon is a general, and he’s quiet wounded down just 0.11% away from that 20% Bear market mark. As of Friday 10-26-18, 43% of stocks were trading at discounts off their highs of 20% or more per Mike Santoli on CNBC, and therefore in their own “Bear markets.” The SPX is down “only” 9.62% so far.
A Catalyst for More Downside or Upside:
If Apple fails to please investors, “Master Market” will likely throw a big fit, especially the NASDAQ and QQQs.
Apple is a stock that has not come off its top by much. They had better hit their numbers when they report on Nov. 1st. The market is saying they WILL hit their numbers. The mess in China (a big part of their growth is in China), India and elsewhere says they actually may miss their numbers. Investors were skeptical about the expensive iPhone X, and the Chinese still bought them, but that was in the last iPhone cycle when their markets were not down over 30%. On the other hand, the new cheaper XR series iPhones may get investors excited about making more inroads in China, so the picture is mixed. Buffett’s professor, Ben Graham taught him, “In the short run, the market is a voting machine but in the long run, it is a weighing machine.” This week investors will be weighing the pluses and minuses and coming up with a NEW price for Apple stock, up or down. If you own the stock, have a plan.
What have I done along the way in terms of overall exposure to equities?
I share my “percent exposure vs. my usual maximum exposure for a Bull market,” so you can consider it and adjust your exposure to taste if you like. If your normal exposure to stocks is 90% because you are 25 yrs old for example, you would now be at 78.25% of that or 70.425% with the rest in short term Treasuries or cash, so it can be moved back into stocks. The following is not an exhaustive list of my moves which are all noted on social media, but it gives you a feel for how I’ve handled my exposure level this year.
At the market peak in January, I was at 102.32% exposure (exp.). Appropriate for a strong Bull market, but aggressive considering my mid-Jan. warning about the super high degree of individual investor Bullishness.
At the Feb. 8th low I was at 94.2% exp. I disposed of almost all foreign exposure then and rotated into QQQ, specific tech names like INTC and MSFT that were bouncing hard, and SPY exp. That worked out beautifully as the US market climbed and foreign markets failed badly subsequently. As an example, had I held DXGE to Friday’s close, my position would now be at a loss of 11.6%. Better to take gains of 1.2% and 1.6% plus several % in dividends along the way than to ride the pony back down the hill. The ego says “a few % is not enough, so wait!” Ignore your ego and risk manage your positions. Europe was already set to head into a slowing of growth, so I left the party. I then made good money as INTC and MSFT bounced from the Feb. low.
At the 5-04 low, I was at about 80.75% exp.
At the 7-10-2018 high, I was at 90.75% exp.
I sold most of my small cap exposure “early” thankfully on 7-16-18 and went down to 86.0% exp.
I sold some SPY exp. 10-04 on the first drop off the top, going to 83.5% exp. In retrospect, I could have sold more of course. That day had the first notable bump in volatility over what the market had been experiencing for a while and volatility did pick up from there.
At the lower high on 10-16 to 10-17: I told my followers on social media I would be selling any bounce in stocks, and I did. Hope you did too, if your exposure was still too high. On the 10-16 to 10-17 bounce to the lower high, I sold some growth exp. and on 10-17 I sold more SPY and all VNQ exp. going down to 73.5% exp.
My recent low exp. was on 10-22 after the further market drop and sell of an individual stock, at which point I was at 71.5% exp.
I added back SPY exposure on 10-22 moving up to 76.25% exp from 71.5%.
I bought more SPY exposure on 10-23 moving to 78.5% exp.
On 10-24 I bought and sold SPYs bringing my exp. to 74.5%. The sell was based on the failure of small and mid caps to hold the prior lows.
On 10-26 I added SPY exp. prior to the GDP release with the market already down, which was a buy very close to the closing price for the day. I also bought some speculative stocks (please always size them smaller than large cap stalwarts) and a bit more Disney to bring my exp. to 78.25% by Friday’s close. I have added exposure as a test of this level for stocks. I am testing the waters, not jerking my exposure back up to 100% with a hope and a prayer.
There is no magic about the May low. That’s about where the market closed on Friday, and it may or may not hold. No one can tell you if it will! Gurus cannot help you. The market’s behavior is at times the only honest guide. If you are fully exposed to this level, you are likely overexposed. If you read that someone says the SP500 Index is “worth X,” don’t rely on it, as markets often overshoot to the upside (as they have done!) as well as to the downside.
Valuation won’t help you here. There are some investors who were sold a bill of goods about China being a “cheap market and it’s a great, modern country. Oh, and it’s being included in the MSCI indexes, so it just has to go up!”
How did that vague story nonsense work for them? Not well. It has fallen over 30% deep in Bear territory. That drop does lay out some possible risk to U.S. stocks, as valuations are eventually compared. There is a level of Chinese stocks that will draw assets away from U.S. stocks, although a low in Chinese stocks may not occur until the Chinese economy starts showing signs of increasing rather than decreasing growth. Remember DECREASING GROWTH is now being served up in the U.S. especially for Q1 and Q2 of 2019.
As I said in several prior issues, there is a risk of returning to the February SP500 Index low which many investors are eyeing no doubt.
I am OK with my exposure level being between 75 and 85% roughly as I trade in and out of the bounces and trounces to come. This is not going to be a straight line. Manage your exposure level to a point you are comfortable with, considering the probable downside of up to 25% over a longer period.
“Up to” does not mean the market will reach the 25% mark. It is a risk assessment. Be willing to add back to the market if YOU are wrong. As I say, it’s you who decide, not me, not the “machines,” not Cramer, YOU. Take responsibility and never whine about the Fed or Trump or….whatever, you name it. Be done with that total crap! The market is what the market is. Deal with it as it is or don’t play. Your choice. But never, ever, ever whine! Rant complete! 😉
Why not lower exposure even more? I may decide to do that, but I’m unlikely to cut it below 70% of usual maximum exposure during this growth slowing period, unless signs of a recession or a worse sell off creep up on us. I am not going too much lower in exposure, because I do not believe a recession is around the corner. Coming yes, but that does not help us. Not coming within a few quarters is the operating view I’m adopting. Non-recessionary pullbacks are typically 13% per a figure CNBC was sharing Friday. We’re at -9.62% now. There is 4.74% to the Feb. low (just a target, not a guaranteed low!). The total drawdown to there from the top would be 13.88%.
What are the outside risks that could lead to a Mini Bear Market?
Remember a Trump impeachment if Democrats decide to go after him (unlikely with current evidence), could cost us a Clinton sized 22.5% or so. Let’s round it to 25%. A GOP Senate won’t convict him in any case. Any non-recessionary “Mini Bear” (as term I coined for a cyclical market decline), can be 20-25% in magnitude. Really I should probably call a drawdown of 15-25% a Mini Bear. Let’s do that. The 20% mark is very arbitrary, so let’s be arbitrary in our own way here.
New Rules (thank you Bill Maher): Market Drawdown Levels of Note
“Dip” >3%-5%. “Correction” >5% to 15%. “Mini Bear” >15% to 25%. “Big Bears” are >25% (often rising to 50% or more for some markets).
There you have it. Dip – Correction – Mini Bear – Big Bear market levels. Remember I renamed “Cyclical Bear” and “Secular Bear” Markets “Mini Bear” and “Big Bear,” because the terms cyclical and secular are often confused by investors. The terms just fly over their heads.
“Big Bears” are related to recessions and typically mean a drawdown of over 25% and up to 50% or so for the SP500 Index, and even more for certain indexes. The drawdown of the NASDAQ in 2000 was 78%. That’s not in the cards this time, because we’re just not at comparable levels, and there is no recession in sight. If things change, we change our minds.
Now let’s check in on two “Canary Signals” we’ve been following:
“Intel-igent Market Timing Signal” (Intel; INTC): Negative. It bounced on stronger earnings than their forecasts and rose above two prior lows. Nevertheless, the stock is still below the 50 day moving average, and the news for semiconductors just gets worse with every report. Texas Instruments is now in a steep decline after saying almost all of their markets around the world were slowing. I warned you here long ago about the global slowing infection of U.S. growth. Now it’s arriving. (Reminder: INTC is our “tell” on 2nd half earnings in tech as noted HERE.)
Bank of America (BAC) Market Timing Signal: Negative and it broke down to a brand new low where it is again seeking support. Stay away IMO.
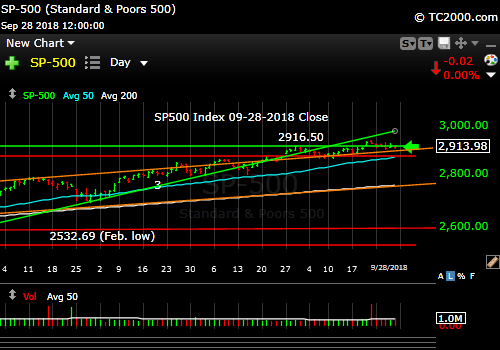
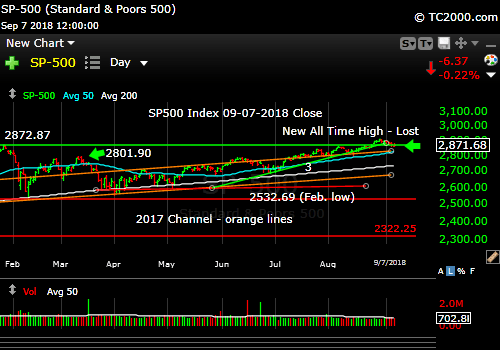
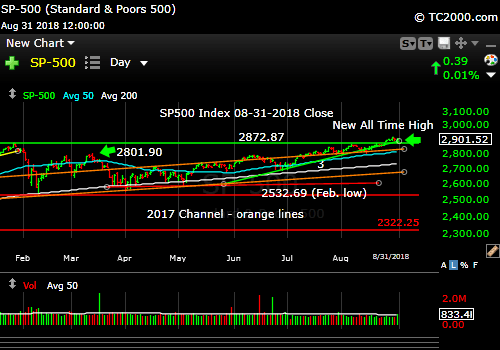
The 2017 channel line is in orange on the chart below…
Keep up-to-date during the week at Twitter and StockTwits (links below)…
Follow Me on Twitter® Follow Me on StockTwits®.
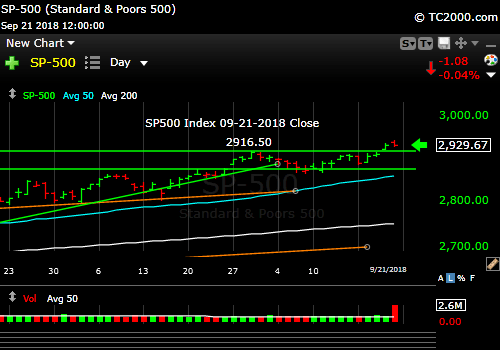
SP500 Large Cap Index (click chart to enlarge; SPX, SPY): Stopped for Friday at the May low. Feb. low next or a bounce?

SP500 Index. Will in continue down to the Feb. low?
Survey Says! Sentiment of individual investors (AAII.com) showed a Bull minus Bear percentage spread of -13.03% vs. -1.11% last week. The spread is not Bearish enough to help us spot a bottom. It does say to me that investors are complacent about this decline however. This survey took the Weds. decline into account as the poll closes Weds. night.
| AAII.Com Individual Investor Sentiment Poll | ||
| Bulls | Neutrals | Bears |
| 27.97% | 31.03% | 41.00% |
| Thurs. 12 am CT close to poll | ||
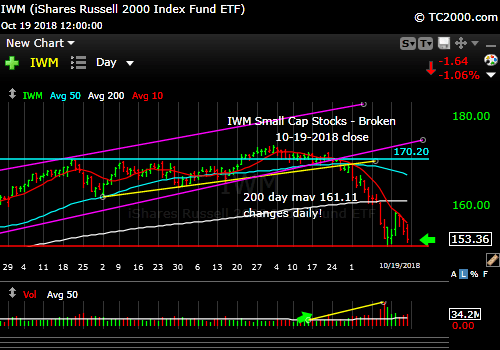
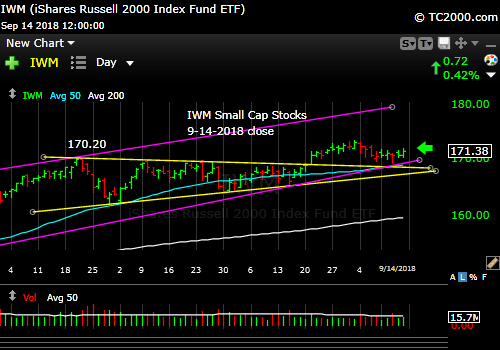
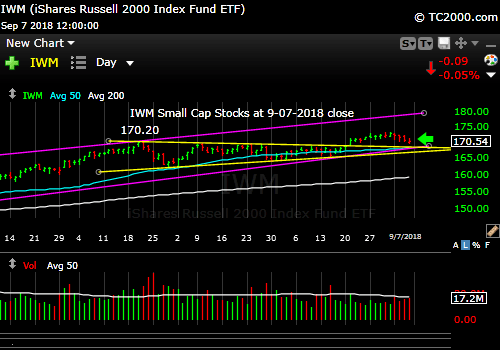
2. U.S. Small Caps Market Timing (IWM): The February low (-3.38% away) is an easy target from here, but they’ll probably bounce when the large caps do if not lead the large caps up. Either could happen on a bounce. They “told me” early on the market was sick, and I’ll be watching their behavior even intraday to find clues to when the market is really bouncing in a meaningful way.
Russell 2000 U.S. Small Cap Index (click chart to enlarge; IWM, RUT):

Small caps broke down earlier than large caps.
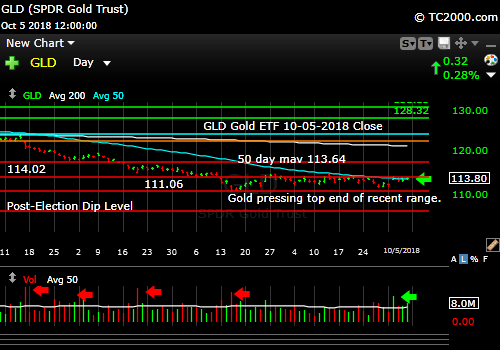
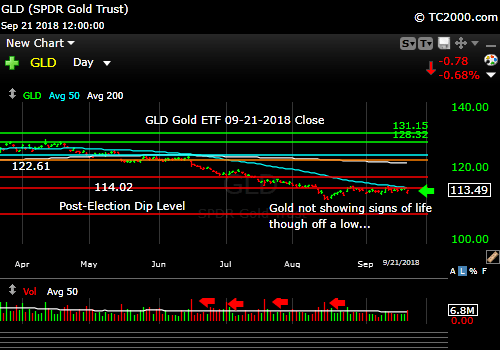
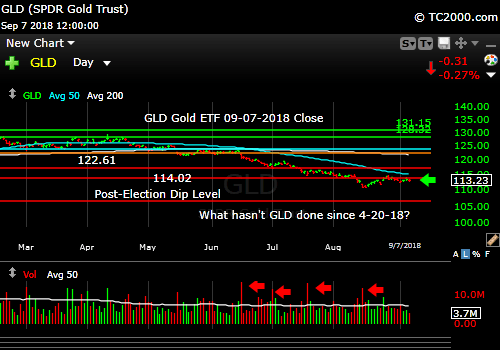
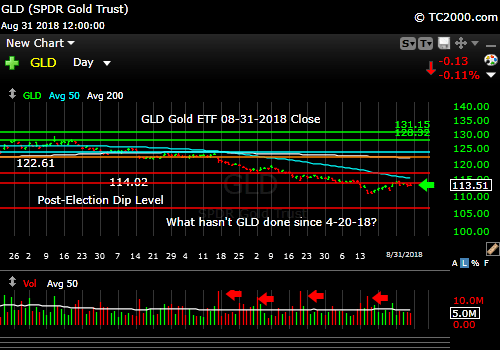
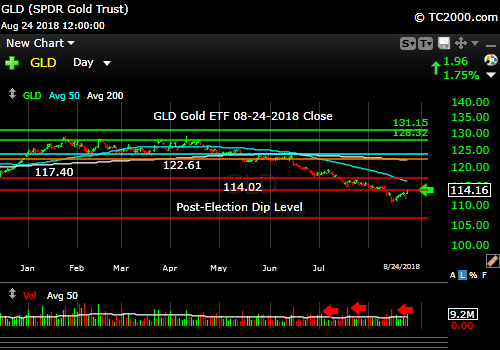
3. Gold Market Timing (GLD): Since 10-16-18, gold has risen with the dollar. Often they have an inverse relationship. Dollar down, gold up and vice versa. In states of financial panic, gold can rise with the dollar. On Friday, gold was up a bit and the dollar was down a bit and rates were down substantially, which pushes real rates toward a minus sign, which gold loves. Read prior gold comments for the link to my educational gold article if you have not read it yet.
The Gold ETF (click chart to enlarge the chart; GLD):

Gold holding up but failed a breakout despite lower rates on Friday with a down dollar.
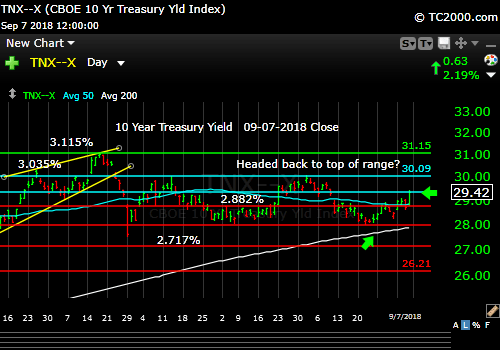
4. Interest Rate Market Timing – U.S. 10 Year Treasury Note Yield (TNX):
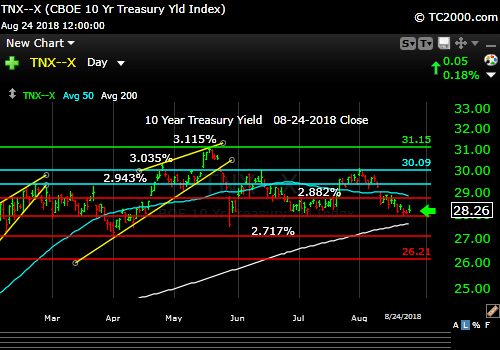
Read my comments above. Next Friday will be the short term key. Intermediate term rates should fall as growth slows. Longer term they’ll rise once again, so our Treasury trade is a trade not a buy and hold!
There was a confounding factor with the stock market volatility this past week. In “risk off,” investors buy Treasuries temporarily, but then may dump them for stocks as stocks bounce. Wages plus a stock market bounce would give the 10 Year Yield two reasons to climb this next week. If the U.S. stock market drops further, the yield will of course drop even more and send Treasury and bond prices up.
Check out the “Market Signal Summary” below – after you review the following chart…
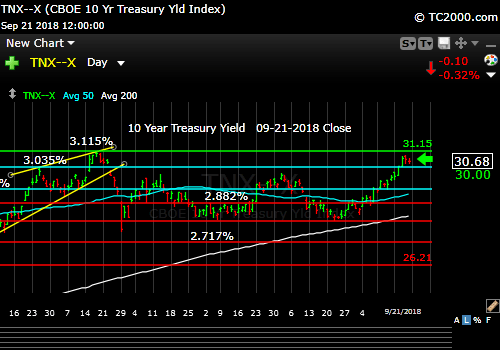
U.S. 10 Year Treasury Note Yield (click chart to enlarge; TNX, IEF, TYX, TLT, TBF):

A rise on wages next week and then a fall on slowing growth.
Now let’s review three key market timing signals together….
Do not use these signals as a trading plan. They are rough guidelines. I currently share my own moves on social media (links above).
MY MARKET SIGNAL AND TREND SUMMARY for a Further U.S. Stock Market Rally with Real GDP Growth (“real” means above inflation):
Stock Signal RED for a further U.S. stock market rally with a BEARISH SP500 Index trend.
Three weeks ago week I said: “The small caps broke down badly, so the SP500 Index could follow them down (as I said, about 6% from the high to start). The small caps are a better indicator of the health of the economy, as they are most vulnerable to economic changes, and hence, are the basis for this signal.”
The VIX (which relates to SPX volatility) closed at 24.16 on Friday vs. 19.89 the previous week. By itself, it’s Bearish, but if it trends down from here on Monday, we have a lower high in volatility established and stocks can bounce hard
Last week I said: “Above 19.55, the VIX level is BEARISH for the SP500 Index, but rising to the 26ish level and then falling could be Bullish short term. The Bulls must retake the 8-15 high of 16.86 (break down below it). The ‘Bull Nirvana Target’ is our VIX # of the Year: 13.31. As I said 2 wks ago, ‘Super Bull Nirvana would be VIX below 11.22, but I have the feeling it will take a while to get back there.'”
The Bears need to take out the 26ish top that was tested once again this week for the market to go into another leg of decline. If they do it soon, it COULD still just last a day or two.
Gold Signal RED for a further U.S. stock market rally with a BULLISH Gold Trend. I changed it from YELLOW to RED, because GLD has been holding up since the breakout from the prior trading range. Higher gold is NOT what you see in a strong economy, so it augers poorly for the U.S. stock market.
Remember GLD is being used as an indicator for the ECONOMY here. I am calling it a BULLISH trend, because of both 1) the breakout above the prior trading range and 2) the stability in the face of rising dollar. GLD needs to break above 117.40 soon.
Rate Signal RED for a further stock market rally with a BEARISH 10 Year Yield Trend. The up trend is now broken.
I’m leaving this important statement here until things change: “This level of the 10 Year Treasury Yield, which is too high for current conditions as explained HERE, will eventually slow the economy.”
I’ll keep this here as a reminder from prior issues: The market seems to have adjusted to rates of up to 3% or so as said in the signal summary HERE” but NOT above there. Sept. 28th issue: “A rapid push higher in rates would mean trouble for stocks, as occurred in early 2018.” That’s what I call “Rate Shock.” This period of rising rates is #RateShockII.”
Note: I’ve updated my criteria for the equity signal for a further U.S. stock market rally to the following: GREEN = Bullish, YELLOW = Neutral, RED = Bearish. In other words, the colors tell you whether the signal supports the stock rally or not, while the Bullish, Neutral, and Bearish designations are about the trend.
A BEARISH trend signal does not mean we should not buy. A BULLISH trend signal does not mean you cannot sell some exposure. It depends on what is going on in the economy and how oversold/overbought the market is at a given point whether the Bearish signal is to be sold, sold on the next bounce, etc. and whether a Bullish signal is to be bought or if profits should be taken. A NEUTRAL trend signal does not mean the end of the Bull or Bear. It means to wait and look for possible subsequent entry points within the existing trend, Bull or Bear, but preserve capital if the entry fails. Our strong intention is to buy low and sell high. By the way, I will keep showing the prior orange “Trigger lines” in the charts for now as reference points only; they have historical value for us from the post-2016 election period.
Thank you for reading. Would you please leave your comments below where it says “Leave a Reply”… or ask a question… Pay it forward too by sending the link to MarketTiming.Blog (that link will immediately connect them to this webpage) to a relative or friend. Thanks for doing that.
Be sure to visit the website for more general investing knowledge at:
Standard Disclaimer: It’s your money and your decision as to how to invest it.
I thank Worden Brothers for the charting system I use to post these charts. If you want to know more about the charting system I use every day, go to my “Other Resources” page here: Other Resources It makes it much easier to follow along with me if you can see the charts and manipulate them on your own computer. It’s a great investment to have an excellent charting system. Check it out with a free trial at the link above.
Finally: Please excuse and report all typos if you are so moved. I do my best to pick up most of them, but have not always found them all. Shoot me a comment (I don’t have to post your typo report as I filter them before publication, but I’ll be grateful to you!)
Copyright © 2018 By Wall Street Sun and Storm Report, LLC All rights reserved.