Market Timing Brief™ for the 6-23-2017 Close (Update 6-26-2017): There’s Room for a 5.4% Stock Market Correction. Gold Bounces. Rates Stay Low.

A Market Timing Report based on the 6-23-2017 Close, published Sunday,  June 25, 2017

I deliver focused comments on market timing once or twice a week.  These are supplemented with daily “Tweets/StockTwits” (see links below).

1.  SP500 Index: After the Federal Reserve raised the Fed Funds rate by 0.25% on June 14th, we’ve had a failed market timing breakout to new highs, and the index is back to where it was at the close just after the Fed statement. Employment is improving steadily, inflation as the Fed measures it is below 2% and they see it a bit lower for the year vs. their prior assessment, and the economy is chugging along at around 2% growth, but far below the 3-4% growth the Trump administration has said is their target.

What about valuation?  You can look up the Shiller PE Ratio (CAPE) HERE and see at 29.87 we’re back at the 1987 peak level and above the valuations seen in 2007 before the Great Recession, but still well below the 2000 peak of around 44.  This means that the market is already expensive, but could become more so if interest rates stay low enough AND if economic growth continues.  Remember, over the short run, which can be several years, PE ratios can be way out of whack, but over the longer term, stock prices follow earnings, whether up or down.  The current earnings momentum for the overall economy is UP.  For this reason, I am remaining long with more exposure than I usually have.

The healthcare system is still not working for a lot of people and it’s a very mixed picture.  For example, I know “wealthy people” who cannot get a policy covering basic care without paying a fortune. Oddly enough, one can honestly say unfortunately AND fortunately for those who need affordable healthcare, it appears the Republicans will after a period of haggling with holdouts, eventually be able to move forward the healthcare bill, now being offered up in the Senate as the “Better Care Reconciliation Act.”  As it stands, both the House and Senate bills will drive up the independent market cost of healthcare for people ages 50-64 by 4-8 times current pricing depending on the source you review.  There are groups who are being hurt pre-legislation and others who will be hurt post-legislation.

Many current Medicaid patients will be displaced into the private insurance sector supported by tax credits.  What they will end up with is up for debate.  Insurers are likely to limit the coverage of “essentials” for these patients to lower costs of coverage.  Remember that our system creates a good deal of waste because of the insurance company middleman which takes its cut.  Without real competition to drive down costs of providing care, the net effect is that our country delivers less care for more money.  The net effect on the healthcare system could be pronounced for the healthcare legislation losers, which will likely include the hospitals, so I would decide NOW what level of profits you want to maintain on our XLV Healthcare ETF and IBB Biotech trades.  Don’t give it all back.  It’s very hard to predict what this moving target of a healthcare bill will mean in the end for the net healthcare provided.  Follow the market timing signals in the market, rather than the news.

There are other landmines ahead for healthcare.   Trump is supposed to deliver on his promise of cutting drug prices in the near future.  This could slash our gains as the impact sets in, despite the recent big run up in drug and biotech company prices.  The rise has been almost straight up for a few days in a row, as though investors believe Trump’s words and actions will be relatively inconsequential.  If not, watch out below.

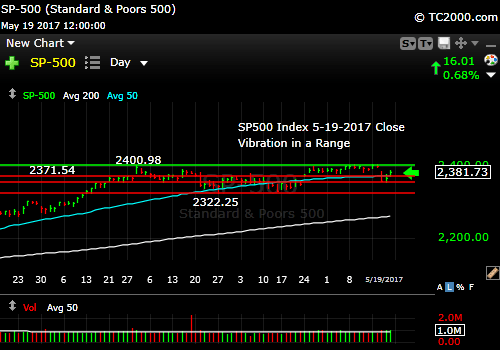
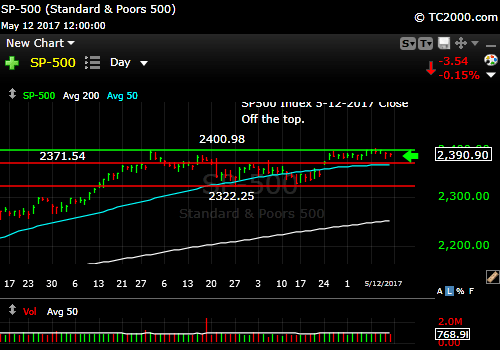
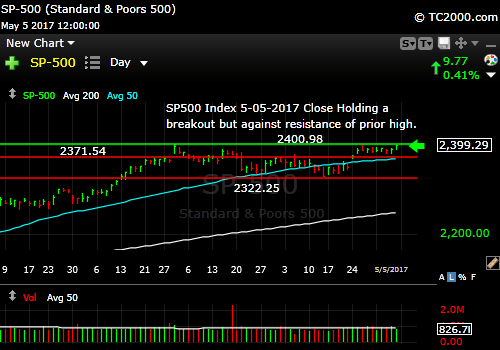
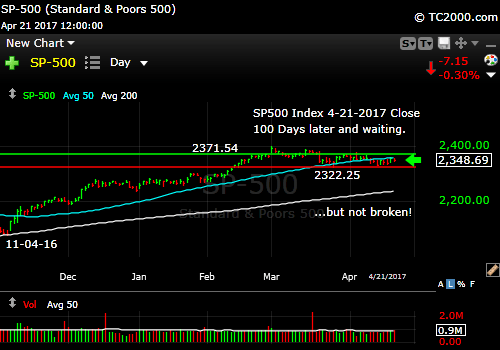
What about the current SP500 market timing chart?  If the lower yellow line in the chart below is broken, it is possible that we’ll only backtest the 2400.98 breakout, but that is not likely in my view.  Then IF we break the green line, the target becomes the red line, which would mean a 5.4% correction from the intraday all time high on 6-19-2017.   The highest fliers would be hit by deeper corrections unless their fundamentals are clearly superior to the market.

Keep up-to-date during the week at Twitter and StockTwits (links below), where a combined 28,080 people are joining in…

Twitter® Follow Me on Twitter®.  Follow Me on StockTwits®.

Review the chart below…

SP500 Large Cap Index (click chart to enlarge; SPX, SPY):

sp500-index-spx-market-timing-chart-2017-06-23-close

Failed breakout.


Survey Says!  Sentiment of individual investors (AAII.com) showed a Bull minus Bear percentage spread of  +3.74% vs +2.79% last week.  The numbers barely budged vs. last week, so please review the comments via the link to the upper right for the issue on the 6-16-2017 close.

Thurs. 12 am close to poll Bulls               32.65% Neutrals 38.44% Bears      28.91%

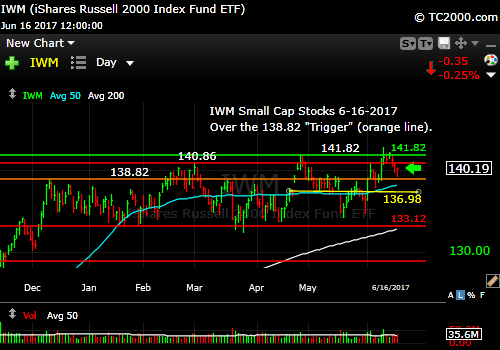
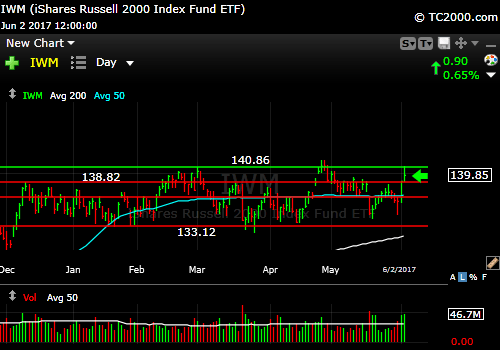
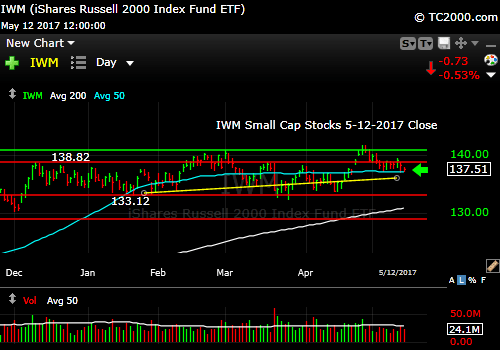
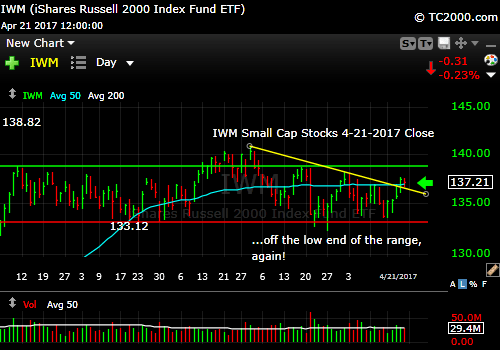
2.  U.S. Small Caps: Our market timing “Stock Signal” is still on, despite the recent “Tech Swoon,” and Fed meeting.  The ETF is still above the orange trigger line shown in the chart below.  I believe a reversal of this signal could mean a full correction in the stock market to that “red line” discussed above.  

Small Cap Update 6-26-2017: Note the distinct difference in behavior during the last retest of the “orange trigger line” vs. the prior retests that failed.  There were two prior breakouts above the line that failed.  This one did not.  That is very positive for a continued rally in small caps.  The index needs to keep marching to a new high to verify this of course, but the odds have changed for more upside. Today the index is lagging the SP500 Index as I post this comment, but still +0.31%, but we’ll have to watch this trade.  Another failure and we’ll be headed at least back to that lower red line or worse.  This does set up a decent trade.  If you enter around here, you could cut your losses on a close below or on a decisive move through the orange line to the downside.

Russell 2000 U.S. Small Cap Index  (click chart to enlarge; IWM, RUT):

iwm-russell-2000-etf-market-timing-chart-2017-06-23-close

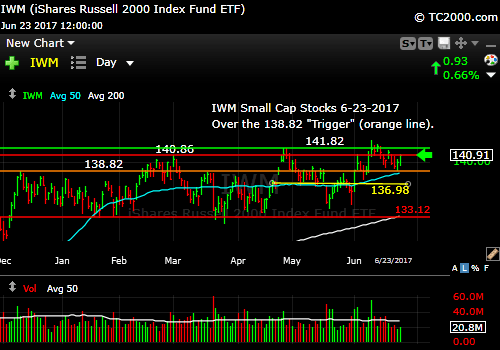
Small caps holding above the prior breakout, but barely above the May high.

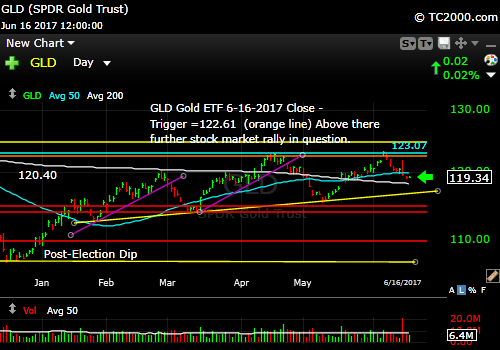
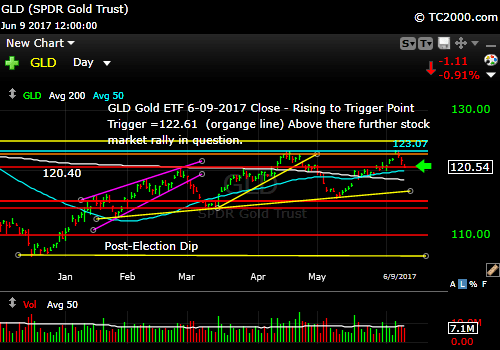
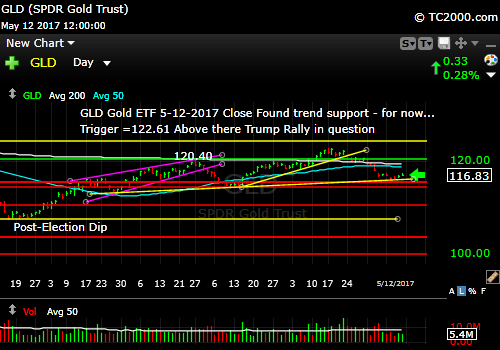
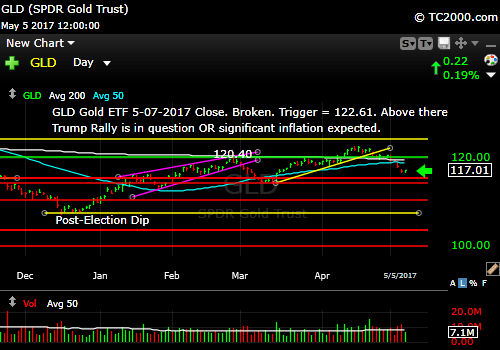
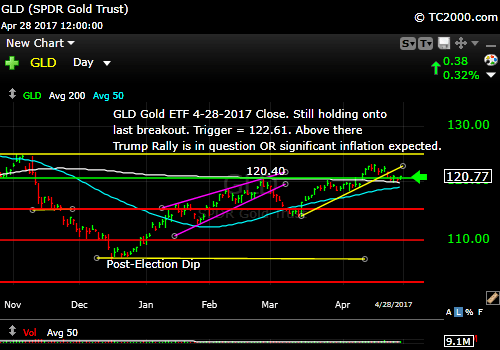
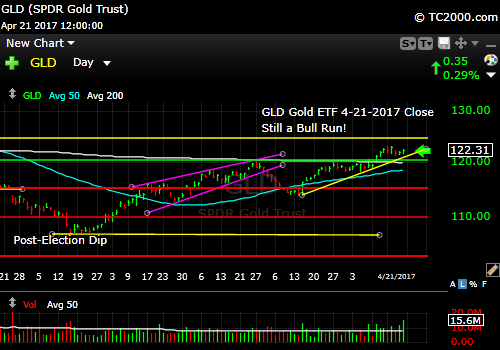
3. Gold: The gold market timing signal is ON, which is technically bad for gold and good for stocks.  That said, gold is in a bit of a bounce.  I’m interested in seeing if the bounce can take us above the horizontal orange and aqua lines on the chart below, because if it can, the Bulls will be back in charge.  If the economy keeps improving with low inflation, gold will tend to lag. 

Gold ETF (click chart to enlarge the chart; GLD):

gld-vs-tnx-market-timing-chart-2017-06-23-close

Attempting a bounce from a higher low?

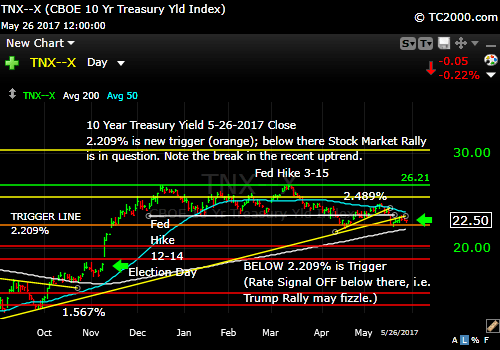
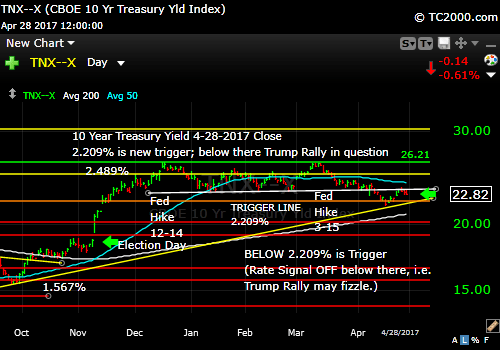
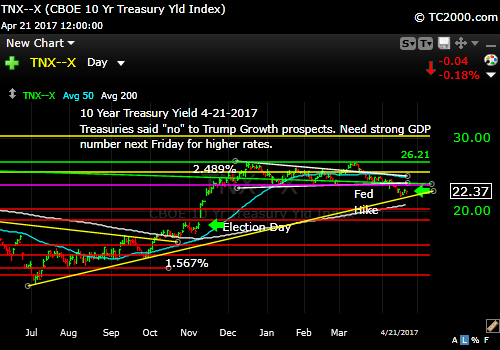
4. U.S. 10 Year Treasury Note Yield (TNX): Rates remain low following the Fed’s increase in the Fed Funds Rate by 0.25% on June 14th.  The Fed’s own inflation estimate for 2017 was DECREASED at the meeting, and if inflation holds steady, rates may not need to rise much.  This should result in delays for further Fed rate increases.  This would mean the returns on bonds may not lose much due to loss of principle value.  Now let’s review the three market timing signals together….

MY SIGNAL SUMMARY for a Further U.S. Stock Market Rally is:

Stock Signal ON, Gold signal ON (good for stocks, not gold), Rate Signal OFF (good for bonds).

U.S. 10 Year Treasury Note Yield (click chart to enlarge; TNX, IEF, TYX,TLT,TBF):

tnx-10-year-treasury-note-market-timing-chart-2017-06-23-close

Notice how rates are still staying low after the Fed hike?

Thank you for reading.  Would you please leave your comments below where it says “Leave a Reply”… or feel free to ask a question…  Pay it forward too by sending the link to MarketTiming.Blog to a relative or friend.  Thank you.

Note: My monthly newsletter is now CLOSED to new subscriptions until late this year.  I’ll let you know here if and when it reopens.

Be sure to visit the website for more general investing knowledge at:

Sun and Storm Investing™

Standard Disclaimer: It’s your money and your decision as to how to invest it.

I thank Worden Brothers for the charting system I use to post these charts.  If you want to know more about the charting system I use every day, go to my “Other Resources” page here:  Other Resources   It makes it much easier to follow along with me if you can see the charts and manipulate them on your own computer.  It’s a great investment to have an excellent charting system.  Check it out with a free trial at the link above.

Copyright © 2017 By Wall Street Sun and Storm Report, LLC All rights reserved.

Posted in Bonds, federal reserve, gold, investment, investor sentiment, large cap stocks, mid-cap stocks, S&P 500 Index, small cap stocks, Treasuries | Tagged , , , , , , , , , , , , , , , | Leave a comment

Market Timing Brief™ for the 6-16-2017 Close: Bulls Still In Charge Despite Tech Dip. Large Value Leads with Small Growth in Rear Since Fed. Gold eases. Rates Still Tame.

A Market Timing Report based on the 6-16-2017 Close, published Sunday,  June 18, 2017

I deliver focused comments on market timing once or twice a week.  These are supplemented with daily “Tweets/StockTwits” (see links below).

1.  SP500 Index: What did the Fed do?  They raised rates 0.25% as expected, but took a hawkish stance according to some, but in fact the Fed lowered their median PCE Core inflation expectation for 2017 from 1.9 to 1.7% and left 2018 and 2019 unchanged at 2.0%.  So maybe they are not so hawkish after all.  Read the dot plot info at this PDF Link from the FOMC).  They currently expect very little additional growth in 2017 over 2016 and a slight DECLINE in real GDP growth going into 2018-2019.  I guess they don’t believe in the power behind Trump’s policies yet, but that could change.

What I observed after the Weds. 2 pm Federal Reserve statement release was a market timing outperformance of value over growth in both the small and large cap ETFs as well as an initial outperformance of small over large caps.  The latter has since reversed as the following chart shows. Note also small growth is now at the bottom (from Fed Statement Weds. up to 6-16-2017 close):

sp500-index-vs-iwf-iwd-iwm-iwo-iwn-market-timing-chart-2016-06-16-close

Value beats growth since the Fed statement was released.

Keep up-to-date during the week at Twitter and StockTwits (links below), where a combined 27,838 people are joining in…

Twitter® Follow Me on Twitter®.  Follow Me on StockTwits®.

Now let’s take a longer market timing point of view.  Look at what the small caps (IWM, IWO, IWN), midcaps (IJH), and large caps (IWF, SP500, IWD) have done since the February 11, 2016 low. The small caps are all bunched up near the top of the chart, large growth (yellow) beat large value which tracked with the SP500 Index.  IJH, the midcaps (purple line) performed at a level between large and small caps.  Large growth IWF (yellow line) somewhat bettered the large value stocks. 

sp500-index-vs-iwf-iwd-iwm-iwo-iwn-since-2016-02-11-low-market-timing-chart-2016-06-16-close

Longer term winners are the small caps.

Now let’s look at the SP500 Index chart and see where we are after the large tech swoon of the past several trading days.  Large caps vibrated in a range ABOVE the last breakout.  That is very positive.  This further proves my point last week that there was a rotation going on between large cap tech and large cap value stocks.  Whether this persists at all is unclear.

SP500 Large Cap Index (click chart to enlarge; SPX, SPY):

sp500-index-spx-market-timing-chart-2017-06-16-close

Still above last breakout.

If growth continues as the Federal Reserve believes it will, growth stocks should not simply collapse from here.  Amazon buying out Whole Foods suggests that the biggest winners are not done continuing to win.  Often when a company buys out another company the buyer’s stock falls, but not so with Amazon which was the best performing of the FAANGM stocks (FB, AMZN, AAPL, NFLX, GOOGL, MFST) stocks as shown on this chart I posted HERE.

Survey Says!  Sentiment of individual investors (AAII.com) showed a Bull minus Bear percentage spread of  +2.79% vs. +5.90% last week.  It’s remarkable that the percentage of Bears did not increase (they actually fell very small amount) after the techs swooned on the prior Friday.  Investors have been piling into bond funds and ETFs near stock market highs.  That is NOT how a Bull market ends, so that would indicate more upside before the Bull fades from sight.  We could have a correction given negative news flow from the Trump administration.  Go back and review my comparison to the Clinton impeachment period if you believe there is zero short term risk to the market. Note that I have not brought down my exposure level, because I still feel with a Republican controlled House, it would require a high burden of proof to impeach the president. 

I don’t like the way the President is handling the investigation.  Instead of cheering on the investigators to clean house for him, President Trump is locking horns with the entire intelligence community and criticizing Special Prosecutor Mueller.  He would get far more done if he were to get out of his own way.  If he is not guilty, he should do a purge of his administration of any involved in Russian collusion and be done with it, so the Congress can focus on the business of the people. Let’s get on with tax and healthcare reform.

Thurs. 12 am close to poll Bulls               32.27% Neutrals 38.25% Bears      29.48%

2.  U.S. Small Caps: Small caps triggered the “Stock Market Timing Signal” to ON, and it remains on despite the Big Tech swoon, which is impressive.  We can still test the orange line and survive (see chart), but we should not break it again, or we may be retesting the bottom of the previous range (133.12ish) or worse.

Russell 2000 U.S. Small Cap Index  (click chart to enlarge; IWM, RUT):

iwm-russell-2000-etf-market-timing-chart-2017-06-16-close

Small caps hold onto breakout.

3. Gold: The “Rate Signal” is OFF, and despite that, gold is selling off.  Gold initially rallied right after the Fed statement, but then when it became clear the Fed was leaning hawkish, gold fell a bit.  If rates stay as low as they are now (below the orange line in the rate chart below), or head lower, gold could well rise again.  Gold should not fall apart while rates are falling, because negative real interest rates are what gold loves. 

Gold ETF (click chart to enlarge the chart; GLD):

gld-vs-tnx-market-timing-chart-2017-06-16-close

Gold slipping despite rate signal being OFF.

4. U.S. 10 Year Treasury Note Yield (TNX): Rates did NOT spike much after the Federal Reserve FOMC Statement was released.  They raised the Fed Funds rate by 0.25% as expected, but continued to believe that more rate hikes are necessary than the market foresees for 2017.  Remember the 10 Year Yield fell after each of the prior two Fed hikes.  This time, as mentioned above, they lowered their median inflation expectations.  Review the data for yourself via the PDF link I posted above.

The Fed has started talking about rolling off their $4.5 Trillion balance sheet.  If the Fed does start reducing its purchases of US long dated Treasuries, I expect rates at the long end to creep up as they also continue slowly raising the short end via the Fed Funds rate.

Overall, significant inflation is not rearing its ugly head in a big way, despite the fact that some costs like rent have jumped quite a bit over the past few years. 

What if inflation remains as subdued as it is now?  Bonds and Treasuries could trade sideways and if the economy does pick up steam as expected, the stock market will do very well and gold will suffer to the extent that real returns are better elsewhere.  Gold remains a form of currency insurance for me and I have no gold trade on at this time.

MY SIGNAL SUMMARY for a Further U.S. Stock Market Rally is:

Stock Signal ON, Gold signal ON (good for stocks, not gold), Rate Signal OFF (good for bonds).

U.S. 10 Year Treasury Note Yield (click chart to enlarge; TNX, IEF, TYX,TLT,TBF):

tnx-10-year-treasury-note-market-timing-chart-2017-06-16-close

Rates stay below trigger post-Fed statement.

Thank you for reading.  Would you please leave your comments below where it says “Leave a Reply”… or feel free to ask a question…  Pay it forward too by sending the link to MarketTiming.Blog to a relative or friend.  Thank you.

Note: My monthly newsletter is now CLOSED to new subscriptions until late this year.  I’ll let you know here if and when it reopens.

Be sure to visit the website for more general investing knowledge at:

Sun and Storm Investing™

Standard Disclaimer: It’s your money and your decision as to how to invest it.

I thank Worden Brothers for the charting system I use to post these charts.  If you want to know more about the charting system I use every day, go to my “Other Resources” page here:  Other Resources   It makes it much easier to follow along with me if you can see the charts and manipulate them on your own computer.  It’s a great investment to have an excellent charting system.  Check it out with a free trial at the link above.

Copyright © 2017 By Wall Street Sun and Storm Report, LLC All rights reserved.

Posted in Bonds, federal reserve, gold, investment, investor sentiment, large cap stocks, mid-cap stocks, S&P 500 Index, small cap stocks, Treasuries | Tagged , , , , , , , , , , , , , , , , | Leave a comment

Market Timing Brief™ for the 6-09-2017 Close: Rotate! Big Cap Tech Sells Off with Rotation into Mid to Small Caps and from Growth to Value. Gold Sinks As Rates Rise.

A Market Timing Report based on the 6-09-2017 Close, published Sunday,  June 11, 2017

I deliver focused comments on market timing once or twice a week.  These are supplemented with daily “Tweets/StockTwits” (see links below).

1.  SP500 Index: A “Bearish engulfing pattern” is a market timing pattern in which the price on a given day makes a higher high and a lower low and closes near the low.  The pattern on Friday in the midst of strong profit taking in Big Tech names did NOT qualify as such a pattern, as the SP500 Index was nearly unchanged for the day.  There was a higher high and a lower low, but the close was at 0.08% for the day. 

Rallies in energy (XLE), financials (XLF), materials (XLB), healthcare (XLV), and industrials (XLI) balanced out the losses in other sectors, but primarily in tech (XLK) at -2.47% vs. the next poorest performer, consumer discretionary (XLY) at -0.44%.  Consumer staples (XLP) were -0.12% and utilities (XLU) -0.09%.

Was that it for the tech sell-off?  The technicals suggest there is room for a bounce early next week ahead of the Fed’s action on Wednesday, which will be to raise rates by another 0.25% to a target range of 1.00-1.25% per CME stats that say the odds are 99.6%.

It’s what the Federal Reserve says in its FOMC statement out at 2:00 pm this Weds. about future rate hikes that could make a difference to the markets, along with the dog and pony show at 2:30 pm ET.  Current projections are for stronger GDP numbers over the current and subsequent quarter or two.  The thing that could hold this back is that businesses had been counting on a successful tax cut package to stimulate growth, but with President Trump mired in trouble over the Russian investigation, visibility has shrunk.  The market does not appreciate political fog, and may this may raise the risk for more than a quick dip in the market.  At the same time, I still expect higher highs in the market before this Bull run is over.  Sentiment is too “mildly Bullish” as you’ll see below to make this a top…

What I observed Friday morning which continued to the close was that money was rotating from Big Tech Growth (QQQ) at – 2.50% for the day to midcaps (IJH) +0.37% and small caps (IWM) +0.52%.  As said, the SP500 Index was only -0.08% for the day.

There was also a rotation from growth to value across the board, even among the large caps.  There could be some further rotation from large cap tech growth stocks into small and midcap stocks and even to large caps with better value.  On Friday SCHG (Schwab Large Cap Growth) was -0.89%, while SCHV (Schwab Large Cap Value) was +0.54%.  This was also true among small caps with IWO (Small Growth) DOWN 0.43% and IWN (Small Value) UP a big 1.38%. 

Again, that’s not a “market sell-off”; it’s a market timing rotation from Big to Mid and Small and from Growth to Value. 

Keep up-to-date during the week at Twitter and StockTwits (links below), where a combined 27,674 people are joining in…

Twitter® Follow Me on Twitter®.  Follow Me on StockTwits®.

SP500 Large Cap Index (click chart to enlarge; SPX, SPY):

sp500-index-spx-market-timing-chart-2017-06-09-close

SP500 still near all time high.

Survey Says!  Sentiment of individual investors (AAII.com) showed a Bull minus Bear percentage spread of  +5.90% vs -4.62% vs last week.  Tops don’t look like this!  There’s more Bull Market to come, even if we see a Trump-based correction.  I personally sense that it will be hard to prove anything against Trump if there are no recordings as it’s simply Comey’s word against his.  Furthermore, the Republicans control the House, which would have to impeach Trump to kick him out, as a sitting President cannot be indicted by a prosecutor, as indictment was felt by the founders to be an easy way to disrupt and destabilize the government.  There would have to be incontrovertible evidence of obstruction of justice for impeachment by the House and then trial by the Republican Senate to convict.

The only pause I have is that the former Federal prosecutor from New York, Preet Bharara said on MSNBC today that no one can conclude yet whether there IS or IS NOT sufficient evidence for obstruction of justice by Trump.  We’ll have to wait and see.  Waiting is NOT something the market enjoys…

Thurs. 12 am close to poll Bulls               35.43% Neutrals 35.04% Bears      29.53%

2.  U.S. Small Caps: Small caps triggered the “Stock Market Timing Signal” to ON, but will have to quickly make a brand new high above the green line in the chart below to confirm the “rotation” was more than a one day thought.  Remember too that in a healthy rally, all indices tend to rise together, even if some under-perform others.

Russell 2000 U.S. Small Cap Index  (click chart to enlarge; IWM, RUT):

iwm-russell-2000-etf-market-timing-chart-2017-06-09-close

Small caps win in the rotation from large to smaller (IJH and IWM) on Friday.

3. Gold: The “Rate Signal” (see TNX below) started to flicker at the end of the week.  So did the GLD market timing signal as it was OFF (above trigger) on Tuesday and off by the next day after a failed breakout.  The reaction to the Federal Reserve’s rate hike will depend on the extent of their perceived hawkishness.  What we know regardless is gold sold off after just ONE DAY above my trigger line.  It was a market timing fake-out.  This happened because rates were UP for three days in a row.  Guess what?  Gold was down three days in a row.  If you follow gold, you must follow interest rates!

If we have a tax reform package by August (looking bleaker), rates could continue higher, which generally is bad for gold which yields zero.  A freeze in DC won’t be liked by the stock market, but gold would appreciate it.  DC stagnation could send rates even lower and gold could benefit.  If things work out for Trump, in the short term you’ll see gold move lower, but long term we’ll have TrumpFlation and gold will respond by rallying.  I see gold as currency insurance still for the Trump “giveaway” plan, creating tax cuts we cannot afford.  He’s no fiscal conservative.  He himself says “I love debt!”  It will be tricky to trade gold in the near term, unless you stick very diligently to buying only the oversold levels and then selling the overbought levels such as the one we just had.

Gold ETF (click chart to enlarge the chart; GLD):

gld-vs-tnx-market-timing-chart-2017-06-09-close

Gold fails a key breakout.

4. U.S. 10 Year Treasury Note Yield (TNX): As I detailed last week, the Fed’s hikes in December and March have led to LOWER 10 Year Treasury yields.  We can expect the same if the Fed raises rates again as expected by nearly every breathing human economist.  Rates will rise at the longer end if growth picks up and the Fed finds itself behind the curve or if the bond market sees that coming.  The market discounts the future whether it arrives or not!

The 10 Year Yield was “playing with my number,” last week flickering  from OFF to ON on both Thursday and Friday and then falling back below the trigger line (orange line on chart below) to OFF.  Long rates are EVENTUALLY likely to rise a bit as the Fed continues to raise short rates as long as growth continues and the Fed action does not shut growth down prematurely.  They won’t be able to roll off their huge balance sheet if they don’t raise rates.  If the Federal Reserve falls too far behind on rate increases when things are good, they won’t have as much room to act if things turn south in the economy.  It’s quite a balancing act and they actually have little visibility as to the impact of their policy moves.  Their GDP predictions are all over the place vs. reality, nearly worthless in the end.  That is why we follow market timing signals and try to avoid over-analyzing everything else.  Profits matter. Actual printed economic numbers matter, but projections don’t as much!  In the end the market price itself is the great truth teller!  They cannot hide price, volume, or volatility.  It’s all there for us to see.

MY SIGNAL SUMMARY for a Further U.S. Stock Market Rally is:

Stock Signal ON, Gold signal ON (good for stocks, not gold), Rate Signal OFF (good for bonds).

U.S. 10 Year Treasury Note Yield (click chart to enlarge; TNX, IEF, TYX,TLT,TBF):

tnx-10-year-treasury-note-market-timing-chart-2017-06-09-close

Rate signal back OFF, but barely.

Thank you for reading.  Would you please leave your comments below where it says “Leave a Reply”… or feel free to ask a question…  Pay it forward too by sending the link to MarketTiming.Blog to a relative or friend.  Thank you.

Note: My monthly newsletter is now CLOSED to new subscriptions until late this year.  I’ll let you know here if and when it reopens.

Be sure to visit the website for more general investing knowledge at:

Sun and Storm Investing™

Standard Disclaimer: It’s your money and your decision as to how to invest it.

I thank Worden Brothers for the charting system I use to post these charts.  If you want to know more about the charting system I use every day, go to my “Other Resources” page here:  Other Resources   It makes it much easier to follow along with me if you can see the charts and manipulate them on your own computer.  It’s a great investment to have an excellent charting system.  Check it out with a free trial at the link above.

Copyright © 2017 By Wall Street Sun and Storm Report, LLC All rights reserved.

Posted in Bonds, federal reserve, gold, investment, investor sentiment, large cap stocks, mid-cap stocks, S&P 500 Index, small cap stocks, Treasuries | Tagged , , , , , , , , , , , , , , , , | Leave a comment

Market Timing Brief™ for the 6-02-2017 Close: SP500 Index Breaks Out to All Time High. Gold Rallying as Rates Crash Through Support.

A Market Timing Report based on the 6-02-2017 Close, published Sunday,  June 4, 2017

I deliver focused comments on market timing once or twice a week.  These are supplemented with daily “Tweets/StockTwits” (see links below).

1.  SP500 Index: We will review sentiment in just a bit, but first let’s review where the markets are…

The large cap U.S. SP500 stock index hit an all time high, and managed to drag the small caps up with it to turn the “Stock Signal” back to ON, but now a new high is needed in the small caps.  As I show below in the small cap market timing chart, they were repelled from the 3-01-2017 high.

The economy continues to be healthy with ISM Manufacturing Index coming in at 54.9 with the prior reading at 54.8.  Click on the 6-02-12017 report HERE and you’ll see the rise in manufacturing activity from the January to February 2016 lows.

In contrast, employment came in weak at 138,000 new jobs created in the month of May with expectations at 185,000.  Some pointed out that employment was up year over year by a small fraction, but if you look at the chart on the prior link at Bloomberg, you can see there is a trend of lower highs since the Nov. 2014 high.  There are ALSO two higher lows that occurred in May 2016 and March 2017.  Making a lower low than the March 2017 low would be Bearish.  Exceeding Feb. 2017 employment would be Bullish.  The employment results reflect an economy that is recovering slowly, but is chugging along.  The market is still expecting eventual progress on the Trump agenda, especially tax reform and infrastructure spending, and there will be a penalty if it does not.

Keep up-to-date during the week at Twitter and StockTwits (links below), where a combined 27,492 people are joining in…

Twitter® Follow Me on Twitter®.  Follow Me on StockTwits®.

SP500 Large Cap Index (click chart to enlarge; SPX, SPY):

sp500-index-spx-market-timing-chart-2017-06-02-close

SP500 Index at ALL TIME HIGH.

Survey Says!  Sentiment of individual investors (AAII.com) showed a Bull minus Bear percentage spread of  -4.62% vs last week’s +2.86%.  This is astounding!  This is not the way Bull markets end as I love to point out.

The time we will be cutting back our market timing exposure levels in the U.S. is when sentiment is peaking at extreme highs.  Until then, the Bull is still apt to be strong.  Of course, I’ve pointed out that the small caps will need to participate if the market is to have serious gains from here.  Large caps can continue to rise alone, but only for so long.

The small cap based “Stock Signal” is ON, but there needs to be follow through to new highs.  By the way, the Neutrals above 40% is one of the most predictive findings of AAII data per their studies.  The likelihood is high that the SP500 Index will be higher 6 months from now, given that > 40% Neutral reading.

Thurs. 12 am close to poll Bulls               26.92% Neutrals 41.54% Bears      31.54%

2.  U.S. Small Caps: Small caps have been discussed and the chart below shows the next market timing “goal line.”  Notice how it pulled off of the green line shown?

Russell 2000 U.S. Small Cap Index  (click chart to enlarge; IWM, RUT):

iwm-russell-2000-etf-market-timing-chart-2017-06-02-close

Need an all time high soon.

3. Gold: Gold is still bouncing as rates plunge below my market timing trigger.  Gold above the trigger would “be OK” if inflation were high along with economic growth, but it’s not.  Remember that high inflation degrades real returns of all interest/earnings yield bearing assets.  The other way gold “works” is when real rates are negative because growth is too slow or falling to or below zero.  In that environment, stocks fall and the Fed has to lower rates to goose the economy back to life.

The PCE inflation indicator that Federal Reserve Chair Yellen likes is still slightly below target at 1.5% without food and energy that she considers volatile (with food and energy the number is 1.7%), still below the prior two months and falling since February as shown on the BEA site.  Gold does NOT do well in times of great prosperity because there are so many alternatives to making nothing on holding gold that has no earnings or dividends.  The rise of gold through market timing resistance this week (see chart below), is a negative sign for the thesis of rising rates with a robust continuation of the economic recovery.  AND YET, the economy IS improving slowly as discussed earlier, and we’ll follow the results, NOT the speculation. 

Gold ETF (click chart to enlarge the chart; GLD):

gld-vs-tnx-market-timing-chart-2017-06-02-close

Gold rally continues as rates FALL.

4. U.S. 10 Year Treasury Note Yield (TNX): I told you last week that below the orange line in the market timing chart below, the “Trump Rally” comes back into question.  The “Interest Rate Signal” is back to OFF (says further robust economic recovery is unlikely). 

We should not be seeing falling rates if inflation is a concern.  In fact, the 10 Year Treasury rate has fallen since the Fed raised rates twice, in December and again in March.  Despite the fall in the 10 Year Treasury Yield shown in the market timing chart below, the Federal Reserve is widely expected to raise rates another 0.25% to a target range of 1.00-1.25% on June 14 at the end of their FOMC meeting that starts on the 13th.  This could drive longer term rates down even further.  This is not what an economic recovery is supposed to look like.

MY SIGNAL SUMMARY for a Further U.S. Stock Market Rally is:

Stock Signal ON, Gold signal ON, Rate Signal OFF.

Once again this week, these signals are close to their switch points.  If 1. Small caps cannot make a brand new high, 2. Gold breaks up through the trigger point and 3. Rates continue to drop, the market message will be that little is expected from the economy or from Trump policy changes.

U.S. 10 Year Treasury Note Yield (click chart to enlarge; TNX, IEF, TYX,TLT,TBF):

tnx-10-year-treasury-note-market-timing-chart-2017-06-02-close

Rate trigger switched back to OFF.

Thank you for reading.  Would you please leave your comments below where it says “Leave a Reply”… or feel free to ask a question…  Pay it forward too by sending the link to MarketTiming.Blog to a relative or friend.  Thank you.

Note: My monthly newsletter is now CLOSED to new subscriptions until late this year.  I’ll let you know here if and when it reopens.

Be sure to visit the website for more general investing knowledge at:

Sun and Storm Investing™

Standard Disclaimer: It’s your money and your decision as to how to invest it.

I thank Worden Brothers for the charting system I use to post these charts.  If you want to know more about the charting system I use every day, go to my “Other Resources” page here:  Other Resources   It makes it much easier to follow along with me if you can see the charts and manipulate them on your own computer.  It’s a great investment to have an excellent charting system.  Check it out with a free trial at the link above.

Copyright © 2017 By Wall Street Sun and Storm Report, LLC All rights reserved.

Posted in Bonds, federal reserve, gold, investment, investor sentiment, large cap stocks, mid-cap stocks, S&P 500 Index, small cap stocks, Treasuries | Tagged , , , , , , , , , , , , , , , , | Leave a comment

Market Timing Brief™ for the 5-26-2017 Close: SP500 Index Takes Off to New Highs. Gold Up and Rates Down.

A Market Timing Report based on the 5-26-2017 Close, published Monday, May  29, 2017

I deliver focused comments on market timing once or twice a week.  These are supplemented with daily “Tweets/StockTwits” (see links below).

1.  SP500 Index: My three signals for a further rally in the stock market are mixed with one signal, the stock signal, in the OFF position, and the gold and interest rate signals ON although nearing their respective switch points.  It’s not that the small caps are behind the large cap stocks since the election.  They are not (see chart below the SP500 Chart).  The issue is there has been no progress by the small caps since the intraday high of Dec. 9th.  Remember that given their higher risk vs. large cap stocks, the gains must be more over time.  They are ahead of large caps since the pre-election low as they should be, but the gap is closing.

The stock signal is OFF with the S&P making new highs, because it is based on the Russell 2000 making a new high above the trigger level (see chart for the number).  It is a measure of market breadth.  There have already been two failures to stay above that level, so it certainly is seen as an important market timing zone for the market.

The small caps are more sensitive market timing predictors and predictors of the health of the overall market than are the large-cap stocks, because when the small-cap stocks start to break down, there is a rotation into the larger names for a period before they also break down. Either that happens or new highs are achieved in all three groups of stocks, namely, small, mid, and large caps.

The tentative nature of trading in the small caps versus large-cap stocks, tells you that the market is not completely sure of the direction it is taking.  Of course, the stocks don’t know any thing of this but their owners do!  

One of the things that has been sustaining the rally is the LACK of overly exuberant sentiment. Despite the high prices in the market versus their relative pricing over time, there is still very little interest in the market given these high prices (see this weeks’ numbers below).  Normally near, or at in the case of the S&P 500, all-time highs, sentiment peaks. Instead it has been mediocre at best. 

In political terms, the market remains confused about whether Trump will be successful in instituting his policies, or whether he in fact will be thrown out for colluding with the Russians in the election. There is no proof that those things have happened despite his very public statements of encouragement to the Russians to interfere in the election by hacking the Democrats emails.  Those statements were wrong for sure, and he’s paying for them now.  No foreign government should be encouraged to hack our elections.  It’s not a joke, even if he meant it that way.

Keep up-to-date during the week at Twitter and StockTwits (links below), where a combined 27,385 people are joining in…

Twitter® Follow Me on Twitter®.  Follow Me on StockTwits®.

SP500 Large Cap Index (click chart to enlarge; SPX, SPY):

sp500-index-spx-market-timing-chart-2017-05-26-close

New high.

IWM (small caps) have not made a new high since December 9th.   Both the midcaps and the large caps have made such gains, even though they trail the overall gains of the small caps since the pre-election low (the midcaps are winning since the 2009 low though, which is why I’ve favored them in setting my exposure levels).  The small caps need to continue their out-performance now as they are riskier.  If not, the entire market will be in danger of falling.     

iwm-russell-2000-etf-vs-spy-vs-ijh-market-timing-chart-2017-05-26-close

SP500 vs. small and mid caps.

Survey Says!  Sentiment of individual investors (AAII.com) showed a Bull minus Bear percentage spread of  +2.86% vs -10.40% last week.  Still not enough Bulls at brand new SP500 Index highs!  More gains are left.  Even if you miss selling before a market timing correction, you’ll be able to increase your exposure lower and sell at new highs in my opinion.  I’ve already told you how much the market would fall should there be an impeachment (see last week’s issue; link to upper right).

Thurs. 12 am close to poll Bulls               32.86% Neutrals 37.14% Bears      30.00%

2.  U.S. Small Caps: Small caps were discussed above.  As long as the economy continues to improve, they should finally make new highs above that Dec. 9th high.  If not, large caps will start reversing market timing breakout gains, and we’ll move into a correction.

Russell 2000 U.S. Small Cap Index  (click chart to enlarge; IWM, RUT):

iwm-russell-2000-etf-market-timing-chart-2017-05-26-close

Small caps still with no new high that has stuck since December.

3. Gold: Gold is bouncing as rates resumed their fall, and this week they were testing a new high above market timing resistance. The trigger point if breached to the upside means stocks are likely in trouble.  Remember the gold signal can trigger and indicate “growth with inflation” running ahead of Fed action, but rates MUST rise if the recovery is solid. 

Gold ETF (click chart to enlarge the chart; GLD):

gld-vs-tnx-market-timing-chart-2017-05-26-close

Gold testing a new level above market timing resistance.

4. U.S. 10 Year Treasury Note Yield (TNX): Below that orange line, the “Trump Rally” comes back into question.  We’re getting close!

MY SIGNAL SUMMARY for a Further Trump Stock Market Rally is:

Stock Signal OFF, Gold signal ON, Rate Signal ON.

Again, these signals are close to their switch points and all three must be confirmed to say the stock market rally is back ON.

U.S. 10 Year Treasury Note Yield (click chart to enlarge; TNX, IEF, TYX,TLT,TBF):

tnx-10-year-treasury-note-market-timing-chart-2017-05-26-close

Rates are moving in the wrong direction for a strong continued recovery.


Thank you for reading.  Would you please leave your comments below where it says “Leave a Reply”… or feel free to ask a question…

Note: My monthly newsletter is now CLOSED to new subscriptions until late this year.  I’ll let you know here if and when it reopens.

Be sure to visit the website for more general investing knowledge at:

Sun and Storm Investing™

Standard Disclaimer: It’s your money and your decision as to how to invest it.

I thank Worden Brothers for the charting system I use to post these charts.  If you want to know more about the charting system I use every day, go to my “Other Resources” page here:  Other Resources   It makes it much easier to follow along with me if you can see the charts and manipulate them on your own computer.  It’s a great investment to have an excellent charting system.  Check it out with a free trial at the link above.

Copyright © 2017 By Wall Street Sun and Storm Report, LLC All rights reserved.

Posted in Bonds, federal reserve, gold, investment, investor sentiment, large cap stocks, mid-cap stocks, S&P 500 Index, small cap stocks, Treasuries | Tagged , , , , , , , , , , , , , , | Leave a comment

Market Timing Brief™ for the 5-19-2017 Close (5-25-2017 China Update): What the Clinton Impeachment Did to the Stock Market in 1998. Market Timing the Mueller Russia Investigation.

A Market Timing Report based on the 5-12-2017 Close, published Sunday, May  21, 2017

I deliver focused comments on market timing once or twice a week.  These are supplemented with daily “Tweets/StockTwits” (see links below).

UPDATE 5-25-17: Chinese Market Timing Chart Update

Chinese large cap stocks listed in Hong Kong (H Shares; FXI) were up nicely today and are about to test 2015 resistance at 40.59.  This progress is being made despite the downgrade of the Chinese credit status by Moody’s.  My contention as some of you know is that the Chinese economy must do well to support U.S. economic growth.  Chinese stocks are much cheaper still than U.S. stocks, so there’s more upside in valuation and the momentum appears to be building again.  The next test will be further proof for the China Bulls should FXI pass it.

fxi-china-etf-market-timing-chart-2017-05-25-close

Chinese stocks make further progress amid negative credit comments.

Now let’s get back to my previous comments on the U.S. markets, gold, etc…

1.  SP500 Index: Market timing is weak when it does not pay attention to economic correlates.  As mentioned on Friday, the NY Federal Reserve Bank’s estimate of Q2 GDP (NowCast™) is  at 2.3%, up 0.4% from their prior prediction, while the Atlanta Fed moved up from 3.6% on May 12th to 4.1% on May 16th.  Keep in mind these predictions are often wildly wrong, although the longer term trends are more reliable than the quarter to quarter estimates. 

The Bureau of Economic Analysis take one quarter and attempt to predict the entire year based on a seasonally adjusted look at GDP, a seasonally adjusted annualized rate (a.k.a. “SAAR”).  It is NOT reliable to do so.  For that reason, some look at annualized averages to smooth the data, while still attending to acceleration/deceleration in the supporting numbers.  There is a lot of guesswork in it, and I’ve seen very well-intentioned research groups fall flat on their faces in predicting the last recession that did not happen!

The key question to answer to determine what your equity exposure level should be and to engage in market timing is “Is the economy accelerating or decelerating?”  And if it is decelerating, it’s critical to get a sense of whether the deceleration is just a blip or a trend that will lead to recession.  Since the last recession, we have had decelerations that are evident in the GDP charts I’ve posted previously, but we never were tipped into a full recession, so the market simply marched higher, most recently based on expectations surrounding the fiscal policies of President Trump.

Here is where we are and then we’ll look at the Clinton impeachment stock market decline.  You can see we’ve bounced off a middle level of support within a trading range…

SP500 Large Cap Index (click chart to enlarge; SPX, SPY):

sp500-index-spx-market-timing-chart-2017-05-19-close-2

Bouncing in the vibrational range.

Only if the investigations of Trump cause businesses to scale back their plans and decelerate the economy do we have to be concerned about the longer term impact.

Now we need to prepare ourselves with the history of prior presidential impeachments (Bill Clinton was the only one impeached since Andrew Johnson, who was also acquitted by the Senate after impeachment by the House) and presidential resignations (Nixon was the only one to resign, who would have been both impeached by the House and convicted by the Senate had he stuck around for it!).

If you believe Trump’s headed to the exits (I don’t at this point, despite the risk), I would scale back to what would be somewhat lower exposure than you generally have with the idea of adding back after/if we get a 10-20% pullback or more.  Nixon left office, but at the time, the economy was a mess unlike now, so the Trump situation is more like Clinton’s than Nixon’s.  We saw a 22.45% pullback in the Bill Clinton impeachment as the monthly chart shows…

SP500-Invex-at-Clinton-Impeachment

President Bill Clinton impeachment impact on SP500 Index

Clinton was impeached on December 19th, 1998.  He then went to trial in the Senate in early 1999.  Note that the market anticipated President Bill Clinton’s acquittal by the Senate almost FOUR MONTHS BEFORE it happened on Feb. 12, 1999.  The impeachment of Clinton turned out to be a blip in a big uptrend.

There is a finite and incalculable risk that Trump will be impeached and/or removed from office.  My concern for the latter is that Trump is exhibiting behavior that smells a bit like a coverup (firing Comey for ex. and all his defensive Tweets) of what happened instead of stepping forward and cleaning up his administration.  That means he himself may have been involved in the collusion that is suspected, though none of this has been proven.

The fact Trump publicly encouraged the Russians to hack the Clinton emails (it’s recorded on video!) certainly makes him suspect, though he could easily claim he was joking to egg the crowds on.  The best case is that he’s being defensive, because he’s protecting his guilty people without knowing who they are.  In other words, the best case is that he’s just blindly trying to shut down the investigations rather than doing so because evidence can be tracked back to his own involvement.

BOTTOM LINE: If Trump was NOT involved in the Russian interference with our 2016 Election, things will go far easier for the U.S. stock market.  There will likely be a few more bumps (dips) along the way and perhaps something a bit more serious such as a mild correction of 5-7%.  As we’ve never seen the removal of a President during good economic times, there’s no guidance from history to tell us how the economy would suffer or whether it could simply chug along.  

My guess is that either impeachment OR removal of Trump could result in a 20%+ correction/mini-Bear market.  Given the current economic picture, we should then recover once the market reassesses the future. 

Keep up-to-date during the week at Twitter and StockTwits (links below), where a combined 27,221 people are joining in…

Twitter® Follow Me on Twitter®.  Follow Me on StockTwits®.

Survey Says!  Sentiment of individual investors (AAII.com) showed a Bull minus Bear percentage spread of  -10.40 from +2.51% last week.  AAII has found that Neutrals being over 40% is a Bullish finding the vast majority of the time in predicting the level of the market 6 months out. It is one of the strongest predictors they have discovered.

Stay long despite the Trump investigations is my take on it.  By the way, a -10%ish Bull minus Bear spread is not that Bearish.  Typically moves to minus 20-30% or more mark temporary and important lows.  The most important lows have very extreme sentiment readings.  We have not seen that.  Dip buyers are stepping in on cue.

Thurs. 12 am close to poll Bulls               23.85% Neutrals 41.90% Bears      34.25%

2.  U.S. Small Caps (IWM,RUT): Small caps never kept their gains above the signal level (top red line) and came close to testing the March market timing low, but not quite.  We cannot know how the investigations will inflect the course of the market, but we’ll stick with trading the range at its extremes.  Right now, we’re in the middle of the range which is not the place to bite unless you are underexposed to equities.  If you are new to this Bull market, you may have to bite every dip you see to participate.

Russell 2000 U.S. Small Cap Index  (click chart to enlarge; IWM, RUT):

iwm-russell-2000-etf-market-timing-chart-2017-05-19-close

Still below signal level.

3. Gold (GLD): Gold is not a good bet in times of positive real interest rates that the markets saw coming after Trump was elected, but in times of turmoil, gold regains a bit of shine.  I believe this market timing move could be short lived, so trade accordingly and keep a good piece of your profits if you bought lower.  Even if gold does well in a period of turmoil leading up to a possible impeachment (not a given), it will have problems thereafter if the economy continues to grow.

Gold ETF (click chart to enlarge the chart; GLD):

gld-vs-tnx-market-timing-chart-2017-05-19-close

Gold bounced further on special prosecutor news.

4. U.S. 10 Year Treasury Note Yield (TNX): It’s fascinating that the 10 Year Treasury Yield tested the market timing “trigger line” I defined several weeks ago (orange line in the chart below)Of course, that line is fairly close to the 4-18-2017 low.  If the recovery is still the belief of the market, that trigger line should hold.  If not, beware, because the market may have decided that Trump’s agenda is in trouble…

U.S. 10 Year Treasury Note Yield (click chart to enlarge; TNX, IEF, TYX,TLT,TBF):

tnx-10-year-treasury-note-market-timing-chart-2017-05-19-close

Rates test the trigger line but bounce.

MY SIGNAL SUMMARY for a Further Trump Stock Market Rally is:

Stock Signal OFF, Gold signal ON, Rate Signal ON.

Again, these signals are close to their switch points and all three must be confirmed to say the Trump Rally is back on track.

Thank you for reading.  Would you please leave your comments below where it says “Leave a Reply”… or feel free to ask a question…

Note: My monthly newsletter is now CLOSED to new subscriptions until late this year.  I’ll let you know here if and when it reopens.

Be sure to visit the website for more general investing knowledge at:

Sun and Storm Investing™

Standard Disclaimer: It’s your money and your decision as to how to invest it.

I thank Worden Brothers for the charting system I use to post these charts.  If you want to know more about the charting system I use every day, go to my “Other Resources” page here:  Other Resources   It makes it much easier to follow along with me if you can see the charts and manipulate them on your own computer.  It’s a great investment to have an excellent charting system.  Check it out with a free trial at the link above.

Copyright © 2017 By Wall Street Sun and Storm Report, LLC All rights reserved.

Posted in Bonds, federal reserve, gold, impeachment, investment, investor sentiment, large cap stocks, mid-cap stocks, S&P 500 Index, small cap stocks, Treasuries | Tagged , , , , , , , , , , , , , , , , , , , | Leave a comment

Market Timing Brief™ for the 5-12-2017 Close (5-19-2017 SP500 Update): Go Away in May? Stock Signal Vacillating but OFF. Gold and Rate Signals On.

A Market Timing Report based on the 5-12-2017 Close, published Sunday, May  14, 2017

I deliver focused comments on market timing once or twice a week.  These are supplemented with daily “Tweets/StockTwits” (see links below).

UPDATE 5-19-2017: Bounce Attempt Under Way

There is a bounce attempt under way, but the volume behind it is weak across large to small caps.  In addition, at least for the SP500 Index, we’re already about half way back to the prior high.  I was already well exposed to the market (numbers on social media), so I have not added here, but it’s a possible place to add a bit of exposure if you are underexposed to equities.  It’s obviously not the best place to add as volatility has already fallen dramatically off the highs.

The lack of volume at this point can be remedied if more Bulls step up as does happen on some bounces – that is, initially there is a lag in buying and then it kicks in at higher prices.  Without that volume, the market is not a great buy at this point…unless as I said you were underexposed to equities in the first place, and then I would add in steps as we may yet retest the low or find a new low based on the immediate news flow.  In a Bull market the game is to buy the pullbacks, not chase the highs.  Have a plan for these pullbacks and act when they arrive…

sp500-index-spx-market-timing-chart-2017-05-19-1030am

Bounce on light volume.

And now back to this week’s issue….

1.  SP500 Index: The market has to wonder about President Trump’s ability to move his agenda forward when he is bringing the entire focus of the government and the American people to the firing of James Comey, now the former Director of the FBI.  Directory Comey behaved badly prior to the election according to both parties, but the disruption of the ongoing investigation into the Trump election campaign through this firing looks suspicious to most.  Trump will have to refocus the nation’s attention elsewhere very quickly or his agenda will likely lose momentum.

Retail sales gains this past month under-performed expectations of a 0.6% increase coming in at 0.4%.  It’s still probably good enough for the stock market, which now expects stronger growth through the end of the year.  We’d better get it!  This was despite the cratering of Macy’s stock on Thursday (minus 17%) and Friday (minus 3%).  Amazon and other online businesses are eating Macy’s business up, despite its own efforts to have an online presence.  This is a trend that will likely get worse before it levels out into a steady state.

Normally this is “go away in May” time, and looking at the SP500 Index chart below, just coming down off the all time high would be a convenient spot to “go away.”  Yet, if growth does come through in the coming quarters, you’ll want to be IN this stock market.  If you are market timing the small moves, you’ll have to be nimble, or you’ll miss part of the gains to come.

Continue reading, and I’ll tell you when I will lower my stock market exposure and summarize the “Three Signals” for a further Trump Rally at the end…

Keep up-to-date during the week at Twitter and StockTwits (links below), where a combined 27,053 people are joining in…

Twitter® Follow Me on Twitter®.  Follow Me on StockTwits®.

SP500 Large Cap Index (click chart to enlarge; SPX, SPY):

sp500-index-spx-market-timing-chart-2017-05-12-close

Backing off the high.

Survey Says!  Sentiment of individual investors (AAII.com) showed a Bull minus Bear percentage spread of  +2.51% vs +8.12% last week.  Investors just can’t get excited with the market near all time highs.  This is a BIG misunderstanding.  Markets that make new highs often head higher not lower.  Although the US market has had a good run, I do not believe it is over yet, because there is more growth in the economy ahead.  When that reverses, we’ll have to lower our exposure again.

Thurs. 12 am close to poll Bulls               32.73% Neutrals 37.05% Bears      30.22%

2.  U.S. Small Caps: Small caps indeed gave up their breakout above my “number” noted in the chart below (in white; top left).  They are virtually resting on a prior support level as you see on the market timing chart below.  As long as this Trump mess does not blow up further, small caps should move higher from here.  Any further weakness could bring a lower test to 133ish.

Russell 2000 U.S. Small Cap Index  (click chart to enlarge; IWM, RUT):

iwm-russell-2000-etf-market-timing-chart-2017-05-12-close

Small caps pulled back to support, below the key breakout number.

3. Gold: Gold is bouncing as rates resume their fall as shown HERE (note the negative market timing correlation of GLD to the 10 year Treasury Yield in yellow) Gold is something you should hold for currency insurance in my view and is not a trading buy at a time when the economy is due to accelerate.

Gold ETF (click chart to enlarge the chart; GLD):

gld-vs-tnx-market-timing-chart-2017-05-12-close

Gold bounces as rates fall once again.

4. U.S. 10 Year Treasury Note Yield (TNX): Rates started falling again at the end of the week breaking the market timing trend as shown in the chart Please note the trigger number in the chart.  Below that line, the “Trump Rally” comes back into question.

I am going to keep the same trigger points for both GLD and TNX despite the moves at the end of the weak and the breakdown of the stock signal.  The stock signal could switch back on and then off again for all we know until the next trend defines itself.  Remember that the game is use market timing parameters to buy the low end of each downward move in a Bull market and this IS very much still a Bull market despite all the warnings you hear.

MY SIGNAL SUMMARY for a Further Trump Stock Market Rally is:

Stock Signal OFF, Gold signal ON, Rate Signal ON.

Again, these signals are close to their switch points and all three must be confirmed to say the Trump Rally is back to a GO.

U.S. 10 Year Treasury Note Yield (click chart to enlarge; TNX, IEF, TYX,TLT,TBF):

tnx-10-year-treasury-note-market-timing-chart-2017-05-12-close

Rates break the trend line to the downside again.

Thank you for reading.  Would you please leave your comments below where it says “Leave a Reply”… or feel free to ask a question…

Note: My monthly newsletter is now CLOSED to new subscriptions until late this year.  I’ll let you know here if and when it reopens.

Be sure to visit the website for more general investing knowledge at:

Sun and Storm Investing™

Standard Disclaimer: It’s your money and your decision as to how to invest it.

I thank Worden Brothers for the charting system I use to post these charts.  If you want to know more about the charting system I use every day, go to my “Other Resources” page here:  Other Resources   It makes it much easier to follow along with me if you can see the charts and manipulate them on your own computer.  It’s a great investment to have an excellent charting system.  Check it out with a free trial at the link above.

Copyright © 2017 By Wall Street Sun and Storm Report, LLC All rights reserved.

Posted in Bonds, federal reserve, gold, investment, investor sentiment, large cap stocks, mid-cap stocks, S&P 500 Index, small cap stocks, Treasuries | Tagged , , , , , , , , , , , , , , , | Leave a comment

Market Timing Brief™ for the 5-05-2017 Close: Macron Wins in France. All Signals GREEN for Trump Rally Resumption.

A Market Timing Report based on the 5-05-2017 Close, published Sunday, May  7, 2017

I deliver focused comments on market timing once or twice a week.  These are supplemented with daily “Tweets/StockTwits” (see links below).

1.  SP500 Index: The French election came out as a big win for Macron (received >65% of the vote), who now needs to find legislators to support his new party.  The French Parliamentary elections are in June.  Our markets may rally a bit more given this result, although it was widely anticipated.  In fact, I saw it as a plus for US markets had the radical (read that racist) candidate won.  It would have destroyed the EU as a trading block.  Yes, it would have also created a near term mess, but the U.S. would have benefited.  Of course, it’s better for European unity that he won.

US Employment was stronger than expected for April at 211,000 vs. the 185,000 consensus (@Bloomberg).  This is enough for the Bulls to move forward with the expected acceleration in GDP through the end of 2017.  In fact, for Q2, the Atlanta Fed expects 4.2% GDP growth (seasonally adjusted Q/Q annualized growth rate, also adjusted for inflation) vs. a puny 1.8% for the Federal Reserve Bank of New York.  This is absurd isn’t it?  That two Federal Reserve Banks can differ so much in their estimates of GDP is remarkable.  In any case, it will be a big acceleration from Q1 GDP which was at just 0.7%.

Keep up-to-date during the week at Twitter and StockTwits (links below), where a combined 26,922 people are joining in…

Twitter® Follow Me on Twitter®.  Follow Me on StockTwits®.

SP500 Large Cap Index (click chart to enlarge; SPX, SPY):

sp500-index-spx-market-timing-chart-2017-05-05-close

Up against the resistance of the prior high.

Survey Says!  Sentiment of individual investors (AAII.com) showed a Bull minus Bear percentage spread of  +8.12% vs. +6.34% last week.  This is a joke in terms of Bullishness!   The reluctance of investors to embrace the stock market near all time highs is remarkable and says there is more ahead for the Bulls.

Thurs. 12 am close to poll Bulls               38.07% Neutrals 31.98% Bears      29.95%

2.  U.S. Small Caps: My latest small cap trade is back to green.  It was a fairly shallow fall as you see on the chart below.  The small cap stock signal is also back to GREEN (see below for the other 2 signals). 

Remember that if you have a long term outlook, it’s important to keep your long exposure long enough to avoid taxes if that is an issue.  It’s also important to avoid being out of the market when it’s rising rapidly, as if you miss those gains, being in the market late raises the risk level of holding stocks.  At the same time, I like to trade out of part of my long equity exposure near highs and go back in near lows, generally when the near-term outlook is cloudy.  This is why I coined the term “Passive Shorting” HERE.

I added back my recent small cap trading position (IWM) and also added more exposure to my midcap position (IJH; which accrue about the same gains as small caps over time with lower risk since they are larger companies).  See the social media links for my current exposure to equities.

Note that being just above the 138.82 signal means the signal COULD reverse.  Climbing back above that level is just the first step in proving the market believes in “Trump Growth.”

Russell 2000 U.S. Small Cap Index  (click chart to enlarge; IWM, RUT):

iwm-russell-2000-etf-market-timing-chart-2017-05-05-close

Small cap signal for a further stock market rally back to ON.

3. Gold: This is a continuation of the prior selling.  I’ve explained why this is happening, so go to prior issues to review the situation.  For now, growth wins over gold.  The markets are expecting further economic expansion.

Gold ETF (click chart to enlarge the chart; GLD): Chart is of the 5-05-2017 CLOSE NOT 5-7 obviously…

gld-gold-etf-market-timing-chart-2017-05-05-close

4. U.S. 10 Year Treasury Note Yield (TNX): Short of further fears based on North Korean craziness from Kim or a Russian US confrontation in Syria, or as we’ve been hearing, along the Alaskan border, I expect the current up trend to continue.  Please note the trigger number in the chart.  Below that line, the “Trump Rally” comes back into question. 

MY SIGNAL SUMMARY for a Further Trump Stock Market Rally is:

Stock Signal ON, Gold signal ON, Rate Signal ON.

Again, these signals are close to their switch points and this means the rally must be born out, by having stocks, gold, and interest rates all continue to trend in their current respective directions.  All three must be confirmed.

U.S. 10 Year Treasury Note Yield (click chart to enlarge; TNX, IEF, TYX,TLT,TBF):

tnx-10-year-treasury-note-market-timing-chart-2017-05-07-close

Rates climb further – note it’s back above the white (upper) trend line.

Thank you for reading.  Would you please leave your comments below where it says “Leave a Reply”… or feel free to ask a question…

Note: My monthly newsletter is now CLOSED to new subscriptions until late this year.  I’ll let you know here if and when it reopens.

Be sure to visit the website for more general investing knowledge at:

Sun and Storm Investing™

Standard Disclaimer: It’s your money and your decision as to how to invest it.

I thank Worden Brothers for the charting system I use to post these charts.  If you want to know more about the charting system I use every day, go to my “Other Resources” page here:  Other Resources   It makes it much easier to follow along with me if you can see the charts and manipulate them on your own computer.  It’s a great investment to have an excellent charting system.  Check it out with a free trial at the link above.

Copyright © 2017 By Wall Street Sun and Storm Report, LLC All rights reserved.

Posted in Bonds, federal reserve, gold, investment, investor sentiment, large cap stocks, mid-cap stocks, S&P 500 Index, small cap stocks, Treasuries | Tagged , , , , , , , , , , , , , , , | Leave a comment

Market Timing Brief™ for the 4-28-2017 Close: Stocks Barely Holding Onto Breakouts. Gold and Treasuries Ease.

A Market Timing Report based on the 4-28-2017 Close, published Sunday April 30, 2017

I deliver focused comments on market timing once or twice a week.  These are supplemented with daily “Tweets/StockTwits” (see links below).

Signal Update 4-30-2017: The Stock Signal is still ON but barely after the pullback on Friday. Gold and 10 Year Treasury Yield Market Timing Signals are also ON provided they don’t break through specified levels to the upside and downside, respectively.  Remember that a gold rally or interest rate decline is a NEGATIVE market timing signal for a further Trump stock market rally, which is the point of the “Three Signals” I am following.  Please see the revisions to Gold and Bond/Treasury Signals (blue paragraphs near top): HERE 

1.  SP500 Index: Consensus for US GDP (quarter over quarter growth seaonally adjusted and projected forward 1 year) per Bloomberg was 1.1% with a range of 0.7 -1.7%. The actual number was 0.7% though the year over year growth was better at 1.9%.  The number was not seen as a disaster, because the markets believe things will improve into the second quarter and beyond into year end.  They see the softness projected forward by the Q1 data as temporary.  You can review the data for GDP headline results HERE.

In the meantime, the SP500 Index market timing breakout is still intact as the chart below shows.  Small caps had a harder day on Friday, during which I took profits out early on.  Yet, the stock market timing signal remains, just barely, in the ON position.

Keep up-to-date during the week at Twitter and StockTwits (links below), where a combined 26,733 people are joining in…

Twitter® Follow Me on Twitter®.  Follow Me on StockTwits®.

SP500 Large Cap Index (click chart to enlarge; SPX, SPY):

sp500-index-spx-market-timing-chart-2017-04-28-close

Prior breakout still intact despite slight dip…so far.

Survey Says!  Sentiment of individual investors (AAII.com) showed a Bull minus Bear percentage spread of  +6.34% vs -12.99% last week.  Still, this is very weak net Bullish sentiment near market highs and suggests there is more to come in this rally. 

Thurs. 12 am close to poll Bulls               38.05% Neutrals 33.24% Bears      31.71%

2.  U.S. Small Caps: I was early buying back the small caps after taking a prior trading profit, but it turned into a profit anyway (see social media for actual results).  You don’t always have to pick the exactly perfect entry point to make a profitable trade.  I’ll wait now to add further exposure in either 1. A deeper pullback OR 2. A run higher and buy on the first pullback in that run.

In other words, I don’t in general like to “chase” and instead look for the market direction and then buy the pullbacks to get on board or expand exposure.  Sure there is a risk of “missing” a few percentage points, but remember that my exposure is already high, and I’m simply trading around it to pick up some additional profits and lowering risk a bit when I drop my exposure level.

If that sort of trading at the margin doesn’t suit you, don’t do it!  Find a plan that works for you and then STICK TO IT!  If you freeze when you PLAN to sell, you have no plan.  If you don’t have a plan, you’ll never improve your investing and trading except by bumbling into success.  I choose and teach a conscious investing and trading path…

The small cap market timing signal is still ON for a “further Trump Rally” as long as it’s above the key level noted on the chart in the upper left (top red line). The failure to achieve a brand new high above 140.86 is already a sign of some weakness however temporary.

Russell 2000 U.S. Small Cap Index  (click chart to enlarge; IWM, RUT):

iwm-russell-2000-etf-market-timing-chart-2017-04-28-close

Small caps backtesting the prior breakout (note white number to far left at top of chart!  That is the breakout level.).

3. Gold: Gold pulled back as rates rose and stocks broke out.  The market timing dance is working as advertised.  Gold can rise either because Trump’s tax “reform” giveaways cause inflation that exceeds the Fed’s efforts to contain it OR because growth is lousy and real returns in the stock market go flat with mild inflation.  The latter combo still gives you negative real rates, which gold LOVES.  If real rates of return in either stocks or bonds are high, gold tends to do relatively badly, sometimes over very extended periods of time (e.g., 1990’s).

Gold ETF (click chart to enlarge the chart; GLD):

gld-gold-etf-market-timing-chart-2017-04-28-close

Gold eases as stocks rise.

4. U.S. 10 Year Treasury Note Yield (TNX): Rates rose as stocks rose, which is the expected market timing dance around another successful UP leg in the Trump rally, but at the end of the week, rates slipped and gold caught a bid with small caps retesting their key breakout…so the Trump Rally market timing signals are right on the edge…  There is more information about the economy due out this week (ISM manufacturing and services as well as the “Employment Situation” jobs numbers on Friday May 5th) and a Fed meeting ending Wednesday May 3rd (statement release only after the meeting; no dog and pony show until June meeting; no rate hike expected by the market per the CME Group). Nevertheless, the Fed Statement or the data could push the market into its next significant move.  Stay tuned on social media at the links above…

Finally, remember geopolitical risk is not gone yet.  North Korea tried to launch another missile which failed, but called into question China President Xi’s ability to twist Kim’s arm.  Trump seems to enjoy saber rattling, although I’m sure the troops on the DMZ and the South Koreans don’t appreciate it much.  They are on the line here if there is any crazy military action taken.  As I laid out in prior issues, there are NO military options because they all end in human disasters.

If the North Koreans were to misfire a missile into Japan (they hit the Sea of Japan not long ago) or fire a rocket into South Korea, the 10 Year Treasury will rally hard, stocks will plunge (5-10% in days) and gold will fly.  There is always a risk, although close to zero, of “totally crazy” manifesting.  The lifting of this cloud should help the markets as will a defeat of the right wing candidate (it does not deserve to have its name mentioned – too lacking in humanity for that)  in the French election next Sunday. 

U.S. 10 Year Treasury Note Yield (click chart to enlarge; TNX, IEF, TYX,TLT,TBF):

tnx-10-year-treasury-note-market-timing-chart-2017-04-28-close

Rates must rise with economic expansion. The decline in rates is a negative for further progress.

Thank you for reading.  Would you please leave your comments below where it says “Leave a Reply”… or feel free to ask a question…

Note: My monthly newsletter is now CLOSED to new subscriptions until late this year.  I’ll let you know here if and when it reopens.

Be sure to visit the website for more general investing knowledge at:

Sun and Storm Investing™

Standard Disclaimer: It’s your money and your decision as to how to invest it.

I thank Worden Brothers for the charting system I use to post these charts.  If you want to know more about the charting system I use every day, go to my “Other Resources” page here:  Other Resources   It makes it much easier to follow along with me if you can see the charts and manipulate them on your own computer.  It’s a great investment to have an excellent charting system.  Check it out with a free trial at the link above.

Copyright © 2017 By Wall Street Sun and Storm Report, LLC All rights reserved.

Posted in Bonds, federal reserve, gold, investment, investor sentiment, large cap stocks, mid-cap stocks, S&P 500 Index, small cap stocks, Treasuries | Tagged , , , , , , , , , , , , , , , | 4 Comments

Market Timing Brief™ for the 4-21-2017 Close (Updated 4-24-2017 AND 4-26-2017 for Small Caps and Gold/Treasury Signal Revisions): 100 Days and Counting In a Sideways Market. Gold Still a Bull. Rates Say No to Growth.

A Market Timing Report based on the 4-21-2017 Close, published Sunday April 23, 2017

I deliver focused comments on market timing once or twice a week.  These are supplemented with daily “Tweets/StockTwits” (see links below).

UPDATE 4-26-2017: Stock Signal ON. Revision to Gold and Bond/Treasury Signals

Small cap stocks (IWM) have given the market timing “all clear” for a big, new leg UP in the Trump Rally.  We are above my breakout number (see chart below for the number).

But what about the gold and interest rate signals that are also keys to a new rally?  Market timing signals need to be grown organically through observation.  Since gold and Treasuries/Bonds overshot to the upside, it would not be reasonable to use the prior markers as the trigger points.  The initiation of a step-wise DECLINE even on short term charts in gold (GLD) and a RALLY in rates (TNX; remember, rates up = Treasuries and bonds down) can be taken in my view as a confirmation of the market timing breakout of small caps (see IWM chart if you don’t know what that is or yesterday’s Tweets/Twits on social media!  I try to not make it too easy for crawlers to find my breakout numbers.). 

NEW Gold and Treasury Signals: First, note that “ON” for each signal means it is confirming a further RALLY IN STOCKS.  I am using short term market timing chart trends to say the recent trends in gold/Treasuries are reversing: for GLD we’ll use 122.61.  A move above there means gold has recovered into possible Bull mode and the signal is OFF (remember, gold tends to do poorly when real returns above inflation are HIGH, so economic growth and gold go in opposite directions as long as inflation stays subdued.  One can argue the latter with rising deficits under an aggressive Trump tax cut plan.) 

The 10 Year Treasury Yield Signal will be considered OFF if it sinks below 2.209%.  Below there the prior trend may be reasserting itself. 

Given the above definitions I am considering all three market timing signals as ON, meaning there is another leg to this Trump Rally ahead of us.  I remain overexposed (see Twitter/StockTwits for numbers – I print them generally after each trade.) to the market vs. my “usual exposure.”  I will talk about this over the weekend in my next post, but I believe that however misguided the Trump Tax Plan is fiscally (will heap LOADS of debt on our children), it will fuel a major leg in the stock market rally.

Remember that market timing signals do not mean once ON they have to stay ON.  Sometimes they are triggered, and we see reversals in the same day or week.  A test of a breakout is just that.  It must be verified by continued buying and a continued uptrend after the breakout despite any normal backtesting that may occur. 

A Warning: We generally DO NOT buy breakouts (unless for a single company with fantastic news that will drive earnings for many quarters to come for ex.), but instead we buy the pullbacks in index ETFs BEFORE the breakout as we just did with IWM.  If you buy a breakout, wait for the first pullback after the breakout (unless things have changed in a big way economically etc. to explain the pullback, in which case you may choose to pass on buying), and you’ll often get a better entry point.

UPDATE 4-24-2017: Le Pen to Lose French Election on March 7th per Markets and World Markets Rally

We will have a GREEN Stock signal in my three signal predictor of a “further Trump Rally” if small caps can close above the critical level shown in the chart below (Green Line at top).  The gold and 10 Year Treasury Yield signals will take a while to turn positive again, but if they are trending down with an IWM win, I’ll take that as a sign that the markets are ready for more gains in stocks.   Once again, the market “has my number,” which simply means the number marking that green line is what the market is now trading around, currently at 138.83 having moved to a high of 139.34 earlier.  Watch that number (testing back BELOW the breakout to 138.70 as I type this).  A close back below the key level will be a negative in at least short term trading. 

The GDP number on Friday is still extremely important to the market.  A number that is too weak will be evidence that the market is more overvalued than investors currently believe.  To be clear, I still believe there is another big push up left in the markets based on further Trump wins, like him or not.  That’s why I remain long with overexposure vs. the usual maximum exposure level (follow social media links for my actual exposure level).

iwm-russell-2000-etf-market-timing-chart-2017-04-23-1024am

Small caps break out…if the gains hold into the close.

And now back to this week’s issue. Read it to understand the set-up for the U.S. GDP release on Friday…

1.  SP500 Index: Gold and bonds/Treasuries have direction, but stocks still do not. The big number out this week, really big, is the U.S. GDP report on Friday at 8:30 am ET.  Market timing mavens need to wake up for this.  The Atlanta Fed expects almost no growth with their seasonally adjusted annualized rate of GDP growth at just 0.5%.  On the other hand, the New York Fed predicts much stronger growth at 2.7% for Q1 2017 and 2.1% for Q2 2017. Consensus per Bloomberg is 1.1% with a range of 0.7 -1.7%.

That tells you pretty much how well these numbers are predicted!  And those are their predictions just 4 working days ahead of the number’s release.

A strong GDP number could help the market extend the current rally to a new leg up.  A very weak number could cause a further dip/correction, as most feel the market is somewhat overvalued.

If we are in the late innings of an economic expansion, we should expect one more push up by the economy and the markets in my view.  Market timing based on valuation is notoriously faulty.  Valuations can certainly help you rebalance your porfolios to a lower equity exposure, but I’m not doing that at this point in the cycle.  My working hypothesis is that Trump Growth will occur due to fiscal policy changes (however delayed) and push this market up one more time prior to a more significant correction. 

Remember that the market doesn’t like uncertainty, so the French election of Marie Le Pen, an anti-immigrant racist (“they’ll steal the wallpaper off your walls” and “rape your wife.”)  would upset the markets temporarily, but remember that as with Brexit, a Frexit would help the U.S. by dissolving the EU Trading block.  The EU cannot survive without France.  It would have no credibility with the UK now also gone.  That would destroy the European currency.  I think the entire experiment was dumb.  Our country is one in which states that are incredibly different are now stuck together.  Texas and California would not agree to be a part of the same country in a 2017 referendum.  There is no unified fiscal discipline in Europe and given that, there can be no viable European Union.  Security issues are also a problem across nations in the EU.

If our markets were to go down on a Frexit from the EU, it would be a buying opportunity.

We’ll continue to follow my 3 signals defined in early February HERE.

As of today the signals are still ALL off for a continued Trump Rally: STOCK SIGNAL: OFF.  GOLD SIGNAL: OFF ( means gold is rallying).  INTEREST RATE SIGNAL: OFF (means Treasuries/bonds are rallying).

Keep up-to-date during the week at Twitter and StockTwits (links below), where a combined 26,570 people are joining in…

Twitter® Follow Me on Twitter®.  Follow Me on StockTwits®.

SP500 Large Cap Index (click chart to enlarge; SPX, SPY):

sp500-index-spx-market-timing-chart-2017-04-21-close

A strong GDP number will push the market to new highs.

Survey Says!  Sentiment of individual investors (AAII.com) showed a Bull minus Bear percentage spread of  -12.99% down a bit more from last week’s -8.41%.  These numbers confirm our strategy to buy the dips given investor sentiment is this bad near all time highs in stocks.

Thurs. 12 am close to poll Bulls               25.71% Neutrals 35.59% Bears      38.70%

2.  U.S. Small Caps: I’m now in the green in my “early” buy in IWM.  Buying at the low end of the range is a routine market timing maneuver.  Even if you don’t trade, I recommend you time your new buys using new capital in this way.

Russell 2000 U.S. Small Cap Index  (click chart to enlarge; IWM, RUT):

iwm-russell-2000-etf-market-timing-chart-2017-04-21-close

Small caps bounce off the prior lows.

3. Gold: Gold is still happy with crashing rates and geopolitical nonsense going on including a French election that could destroy the European Union.

Europeans hiding in gold of late could come OUT of hiding if Le Pen loses and sell.  A Le Pen victory on Sunday, May 7th could add some fire to the gold rally.  Gold has entered a consolidation over the past few days.

Gold ETF (click chart to enlarge the chart; GLD):

gld-gold-etf-market-timing-chart-2017-04-21-close

The destruction of the Euro on a Le Pen victory would drive gold up further.

4. U.S. 10 Year Treasury Note Yield (TNX): The financials are testing the January lows still, based on the dive in interest rates in March.  If the GDP number is “hot,” yields will shoot up quickly.  If very cold, the 10 Year Treasury Yield could easily revisit the Election Day levels.  Remember too that US Treasuries see a market timing rally if the Euro is doomed by a Le Pen win on May 7th – a flight to safety rally away from the Euro.

U.S. 10 Year Treasury Note Yield (click chart to enlarge; TNX, IEF, TYX,TLT,TBF):

tnx-10-year-treasury-note-market-timing-chart-2017-04-21-close

Rates showing no signs of a rally. GDP could change that.

Thank you for reading.  Would you please leave your comments below where it says “Leave a Reply”… or feel free to ask a question…

Note: My monthly newsletter is now CLOSED to new subscriptions until late this year.  I’ll let you know here if and when it reopens.

Be sure to visit the website for more general investing knowledge at:

Sun and Storm Investing™

Standard Disclaimer: It’s your money and your decision as to how to invest it.

I thank Worden Brothers for the charting system I use to post these charts.  If you want to know more about the charting system I use every day, go to my “Other Resources” page here:  Other Resources   It makes it much easier to follow along with me if you can see the charts and manipulate them on your own computer.  It’s a great investment to have an excellent charting system.  Check it out with a free trial at the link above.

Copyright © 2017 By Wall Street Sun and Storm Report, LLC All rights reserved.

Posted in Bonds, federal reserve, gold, investment, investor sentiment, large cap stocks, mid-cap stocks, S&P 500 Index, small cap stocks, Treasuries | Tagged , , , , , , , , , , , , , , , , , | 2 Comments