A Market Timing Report based on the 11-18-2016 Close, published Sunday November 20th, 2016
I deliver focused comments on the markets. These are supplemented with “Tweets/StockTwits” (see links below).
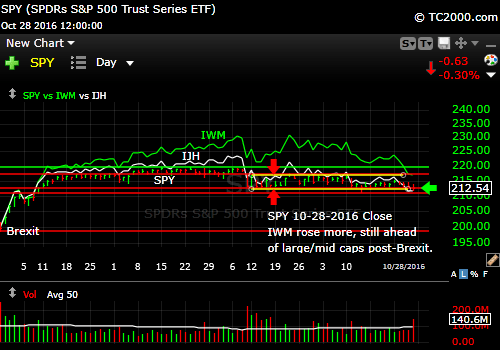
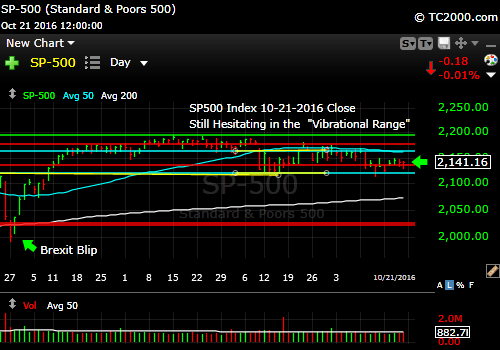
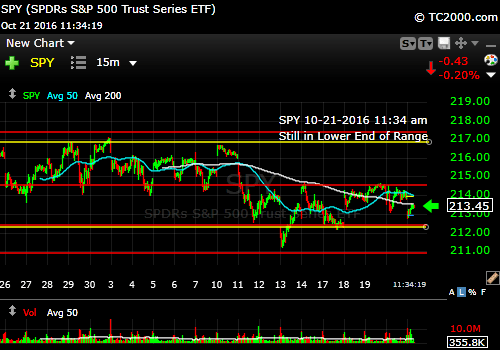
1. SP500 Index: You see in my title this week exactly where new stock market investment will arise. People buy things that are going up and sell things that are going down in general. I expect further highs in sentiment over the next few weeks (see below). There will be market timing dips along the way that should be bought, not sold. The economy must respond for all this to come to fruition, but a strong stock market helps spending. Fiscal stimulus adds jobs and increases spending. The Fed finally has something solid to raise rates against (or will within a year or less as Trump policies are enacted post 2016 Election), so it will hike rates in December.
We are back up again, now testing the prior SP500 Index market timing high. Along this path, I was Bullish and 100% invested, adding back 5% exposure on Nov. 1st to 100% equity exposure vs. my usual maximum exposure, as I like to put it. The reason I do that is so you can adjust it to your age and desired level of risk/opportunity. This is NOT where you add more unless you own nothing. If you buy a breakout, that breakout may fail, but you can sell a reversal. And you can rebuy it if that reversal is a fake-out itself. Does that sound hard? It’s hard to do emotionally for 95% of investors, but this site is for the 5% left. It is for the 5% that believe in making money without taking extreme risks, but also in preserving capital. Discipline is the only way out of fear and loss of opportunity.
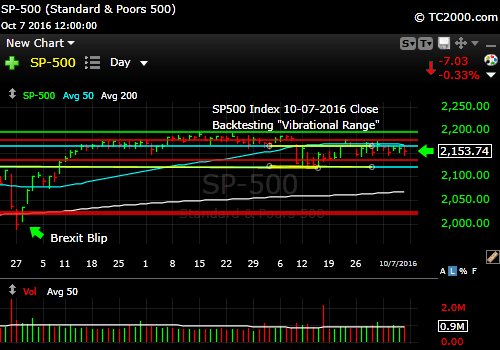
SP500 Large Cap Index (click chart to enlarge; SPX, SPY):
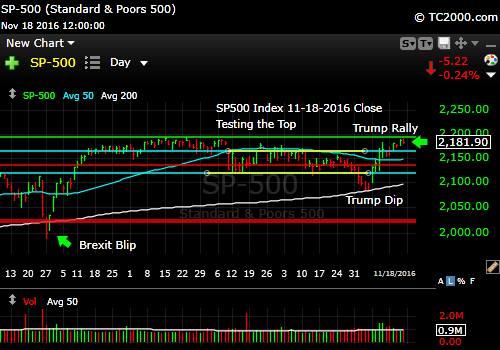
Trump rally testing a Top!
Keep up-to-date during the week at Twitter and StockTwits, where a combined 21,732 people are joining in…
Twitter® Follow Me on Twitter®. Follow Me on StockTwits®).
Survey Says! Sentiment of individual investors (AAII.com) showed a Bull minus Bear percentage spread of +20.08%, was WAY up from the prior week, which was only at +9.6%. That was the best sentiment reading since the +20.4% spread reported on 11-05-2015 (for the poll closing at 12 am). There is room for more conversion toward Bullishness as a 30% spread toward Bulls is not uncommon in a strong Bull market.
Last week I told you there was room to move to 20-30%. The last higher surge of sentiment than the 11-05 number occurred with the 2-19-2015 report date’s surge to +29.1%. The next highest was on 11-04-2014 to +37.6%. See the recent pattern? November surges. In 2013 there was an October surge to 31.6% and then a December surge to +36.5% at the Dec. 26th report.
I expect this sentiment surge to continue at least to the 29% level from here. Trump Fiscal stimulus is on the way, which is like “Christmas for the Markets.”
The percentage of “Neutrals” is far BELOW 40% this week (above 40% Neutrals is Bullish on a market timing basis for higher prices out 6 months from today per AAII studies of their statistics). I think that means that we should expect another dip or two in the next 6 months. These may be more shallow than before.
| Thurs. 12 am close to poll | Bulls 46.65% | Neutrals 26.77% | Bears 26.57% |
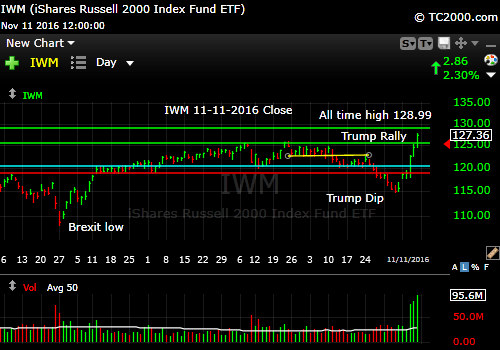
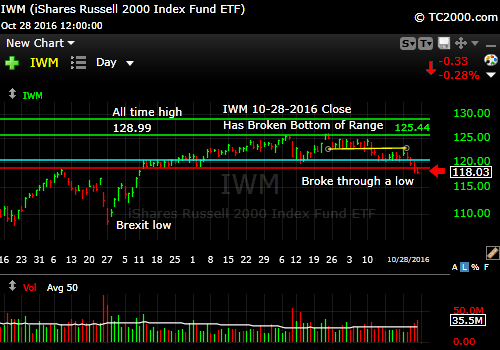
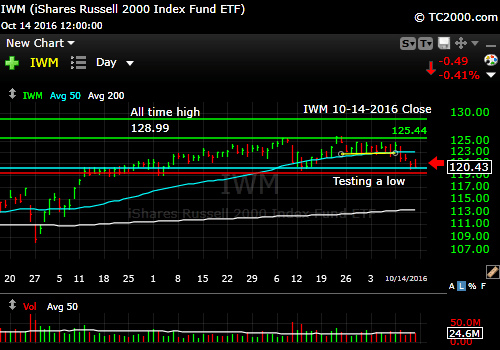
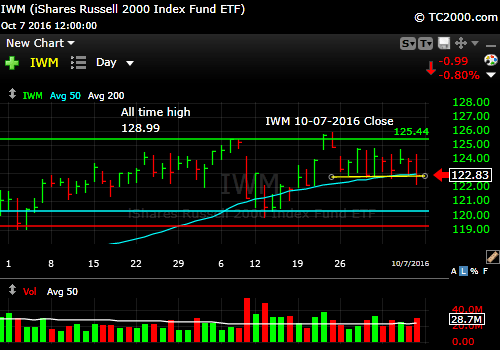
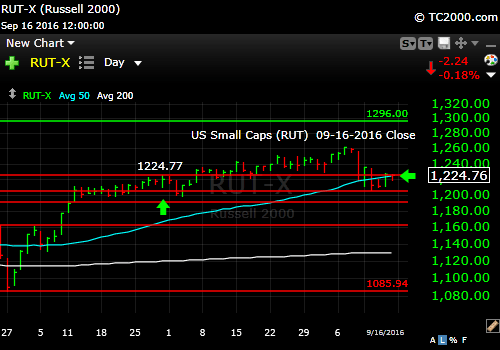
2. U.S. Small Caps: They are at a new post-election market timing high and at an all time high. They have the benefits of increased U.S. growth to come from the Trump Fiscal Stimulus Plan, as well as insulation from trade war fears and U.S. dollar strength. Due to the lack of GAAP trailing 12 month earnings on the part of small caps (see HERE), we’ll stick with U.S. midcap stocks for now along with large cap exposure. Follow my Twitter/StockTwits feeds to see what my new buys are this week or next.
Russell 2000 U.S. Small Cap Index (click chart to enlarge; RUT, IWM):
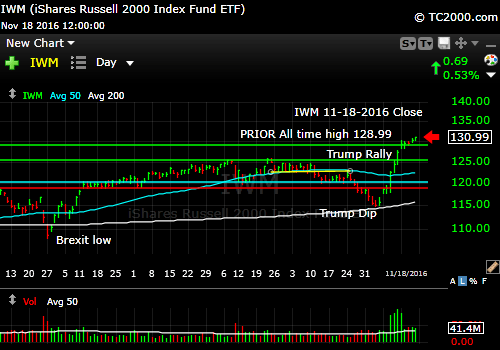
New highs for small caps. Growth and trade war protection.
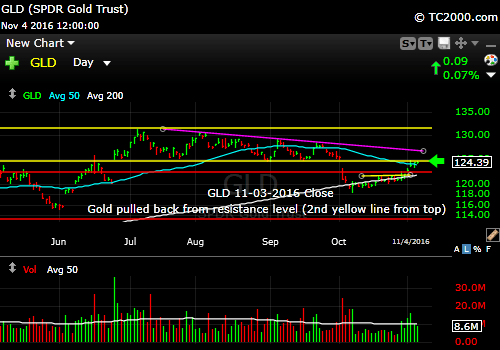
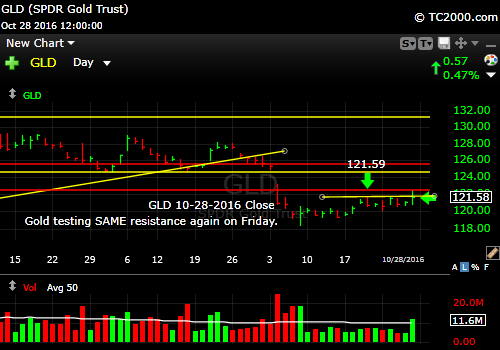
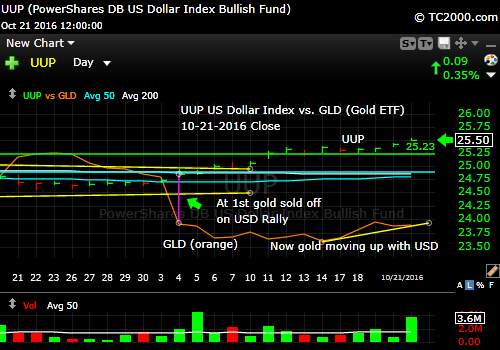
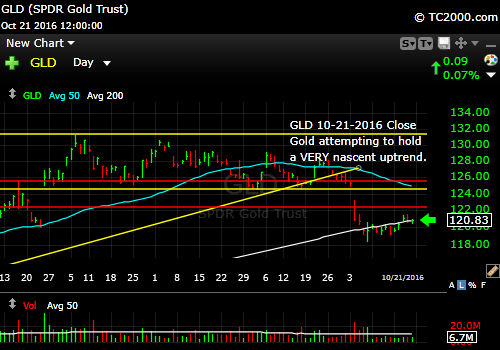
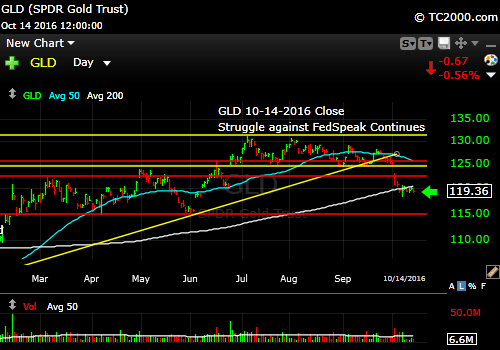
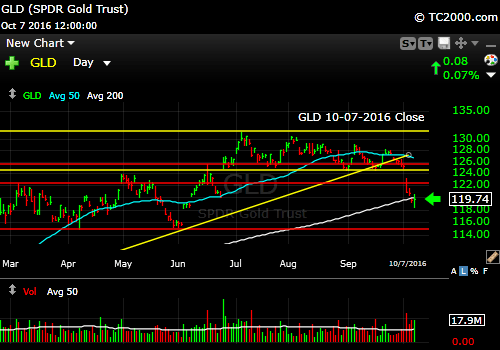
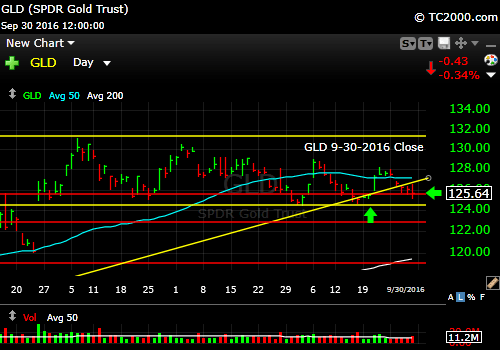
3. Gold: Gold is on its knees post-Trump’s election, because the market expects higher growth and inflation, but APPARENTLY it expects the Fed to stay ahead of inflation, creating positive real rates of return for the markets. See my prior article by Googling “When Does Gold Shine.” It explains when gold works and when it does not. We may be letting go of some gold exposure, IF the current support is breached as a market timing call. I don’t recommend super-tight stops, because the market makers will often come in and trigger then and then bring the market back up higher.
Gold ETF (click chart to enlarge the chart; GLD):
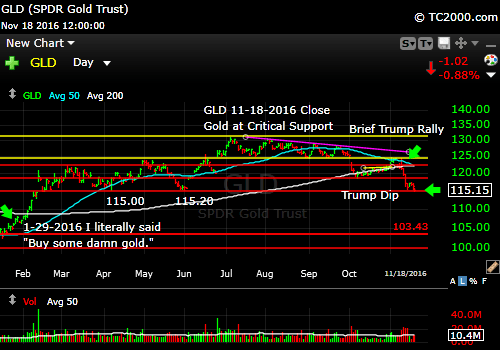
Gold is on its knees. Preserve profits if it breaks.
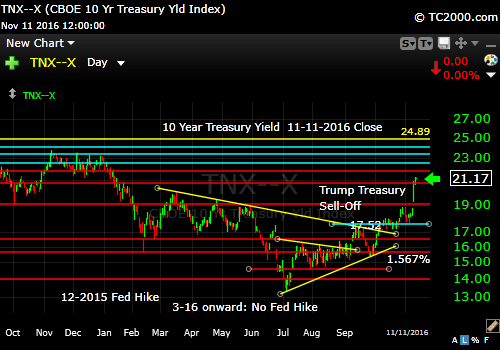
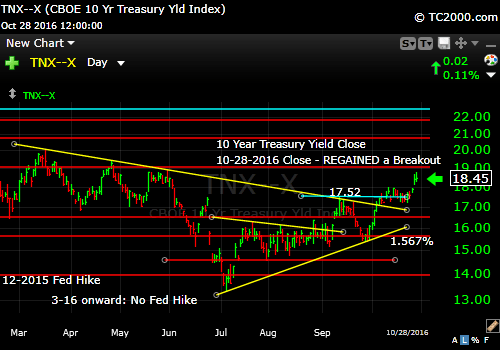
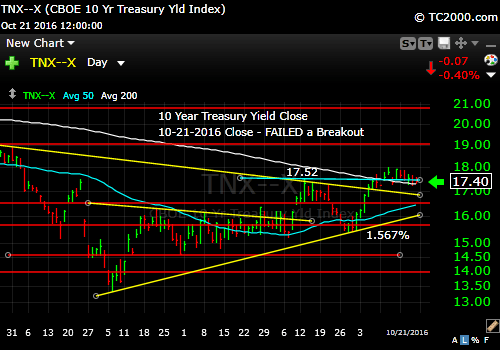
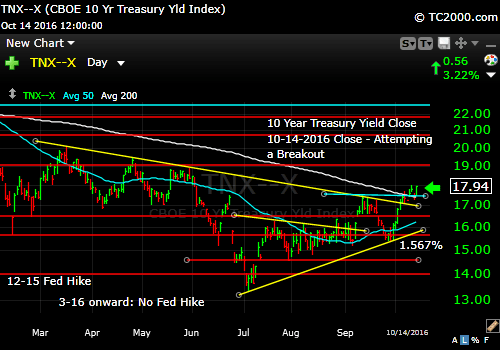
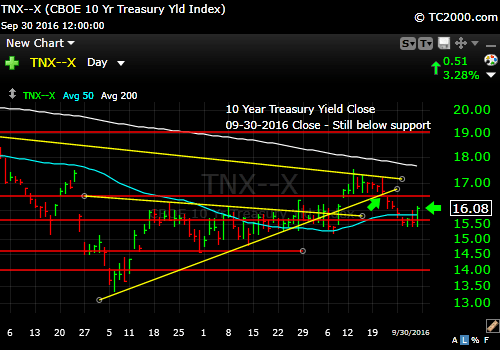
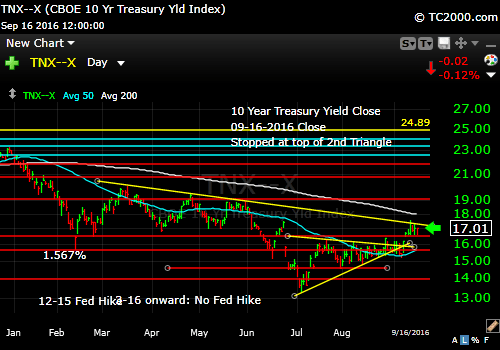
4. U.S. 10 Year Treasury Note Yield (TNX): Rates have shot up as discussed last week. Same story this week. They could go still higher. They are getting ahead of the economy at this point, but it’s a tough call to bet against the efficacy of the Trump fiscal stimulus.
It also appears that the market believes Trump’s policies will be inflationary. HOW inflationary is the question. If rates stay ahead of inflation, then gold will do poorly. Higher rates with higher inflation is part of a recovering economy. Note that the Fed is already behind in normalizing rates vs. the usual path after an economic turn-down. The other point though is that this recovery is the worst one since the Great Depression. Interest rates will have their dips from here, but I expect higher rates to prevail over time as our national debt grows. The key for fiscal spending is that it can help if it’s directed toward increasing the productivity of the economy, as I’ve mentioned and as Dr. Yellen of the Federal Reserve explained this past week. Some will be, but some won’t. The balance will feed into interest rates.
U.S. 10 Year Treasury Note Yield (SHOULD Say 11-18-2016 Close; click chart to enlarge; TNX,TYX,TLT,TBF):
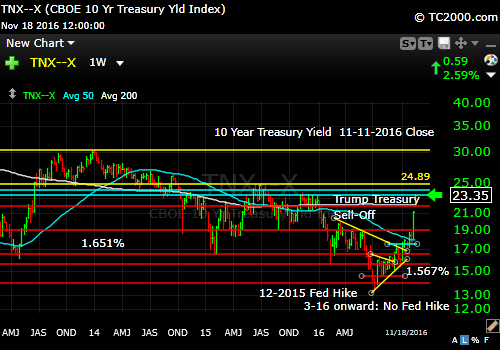
Rates shoot up on expectations of growth and inflation.
Stay with me throughout the week for the LATEST via the links to Twitter/StockTwits above. Feel free to ask me questions, comment, retweet etc.
Note that ALTHOUGH my newsletter is now CLOSED to new subscriptions: You can Join the Wait List to Receive the Newsletter as a Loyal Subscriber, Opening again for the January 1st issue. Note that if you join and don’t read the newsletter, you will be deleted. Why? I don’t publish to non-readers as other newsletters do. I surround myself with committed people who value what we are doing. Stay tuned here in the meantime and follow all the action via the Twitter® and StockTwits® links above.
Be sure to visit the website for more general investing knowledge at:
Standard Disclaimer: It’s your money and your decision as to how to invest it.
I thank Worden Brothers for the charting system I use to post these charts. If you want to know more about the charting system I use every day, go to my “Other Resources” page here: Other Resources It makes it much easier to follow along with me if you can see the charts and manipulate them on your own computer. It’s a great investment to have an excellent charting system. Check it out with a free trial at the link above.
Copyright © 2016 By Wall Street Sun and Storm Report, LLC All rights reserved.