A Market Timing Report based on the 4-15-2016 Close, published Sunday April 17th, 2016
I deliver focused comments on the markets. These are supplemented with “Tweets/StockTwits” (see links below).
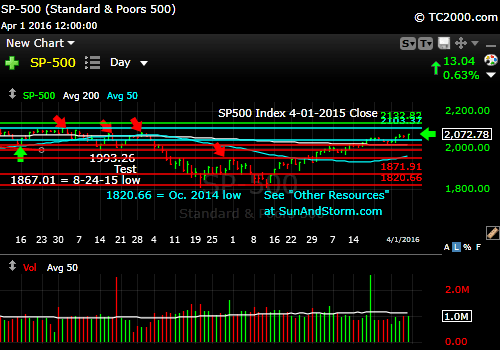
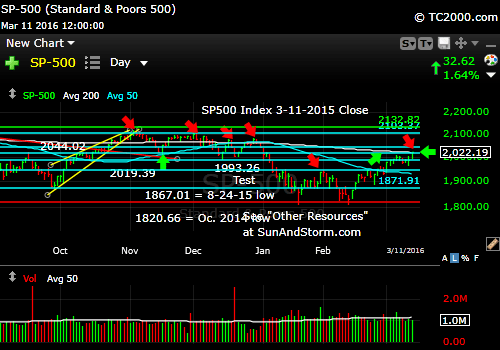
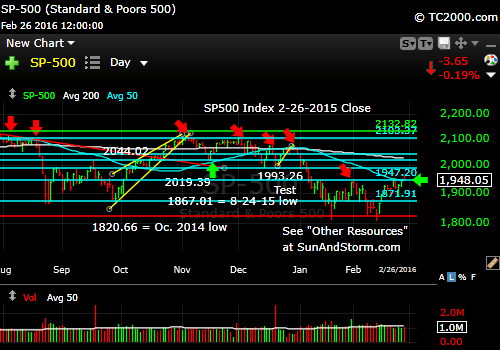
1. SP500 Index: The stock market bounce continued up above the down trend line I pointed out last week with an earnings season that started by meeting lowered expectations this past week. Alcoa (AA), which leads the official earnings season, is up since its so-so report. Earnings were 0.07 vs. the 0.02 expected. The game seems to still be the Fed regardless of the fact that the other countries engaging in monetary easing are not getting great results. Japan, in fact, is in recession. The results in Europe are mediocre.
Tonight with failure of OPEC et. al. to secure a production agreement has oil down 4.62% with SPX futures falling 0.5%. This could be an inflection point and turn out to be a false test above the trend line rather than a confirmed breakout. Markets tend to disappoint the largest number of investors possible, and at these levels, the Bulls are more vulnerable. Another higher high for the SPX would mean we’ll likely re-top however. That’s not my position on the market, but you must be aware of the upside potential even when the downside potential is there.
SP500 Large Cap Index (click chart to enlarge; SPX, SPY):

Breaking up and out or just a tease?
Sentiment fell this week among individual investors (AAII.com) AS the market RALLIED with the Bull minus Bear spread at +2.96% this week (Bulls 27.85% and Bears 24.89% with Neutrals a Bullish 47.26%). See comments from four weeks ago on why that Neutral number is Bullish.
Please keep up to date at Twitter and StockTwits: See my messages on Twitter® Follow Me on Twitter®. Follow Me on StockTwits®).
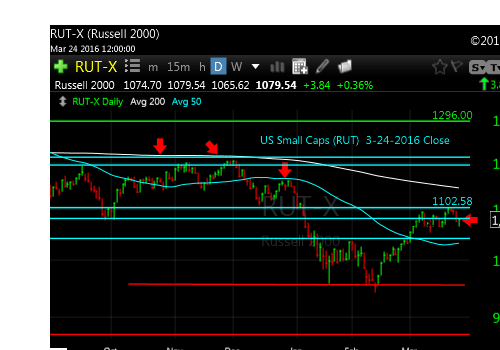
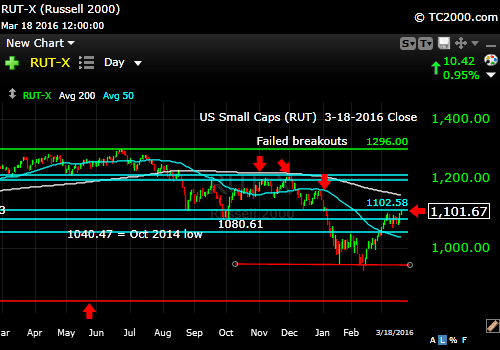
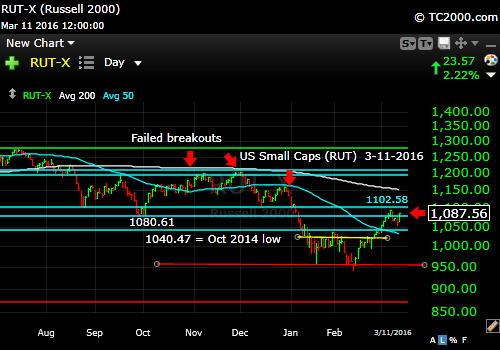
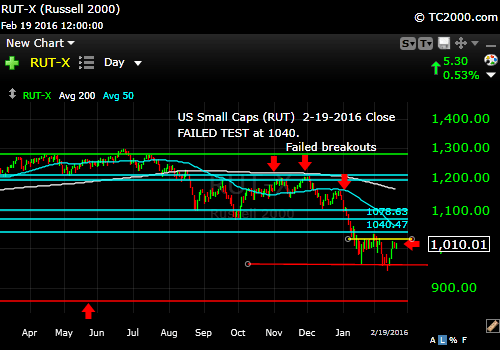
2. U.S. Small caps are STILL above the 1040.47 level that for me defines a Bear market transition point, but small caps could top out right at the yellow down trend line.
Russell 2000 U.S. Small Cap Index (click chart to enlarge; RUT, IWM):
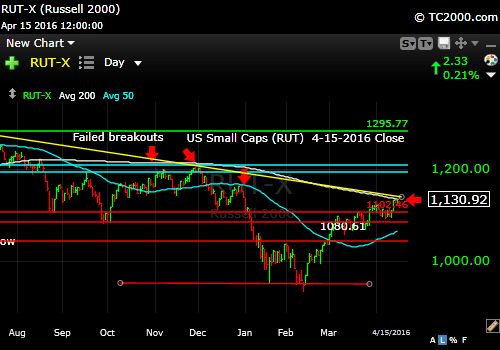
Testing the 200 day moving average. End of the Bear or the Resumption?
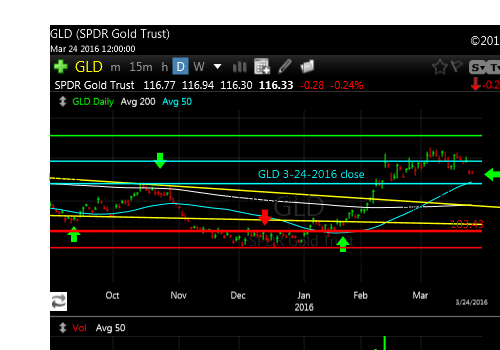
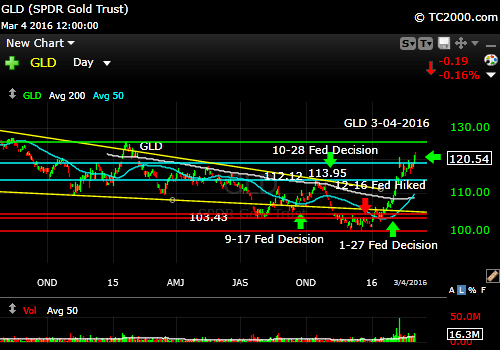
3. Gold: GLD fell back and tested the 50 day moving average yet again and has held up well following a powerful rally in February as mentioned last week. STILL TRUE: “The main threat to further progress is the U.S. dollar rallying from here. Typically gold only rallies with the dollar in times of panic.”
Gold ETF (click chart to enlarge the chart; GLD):
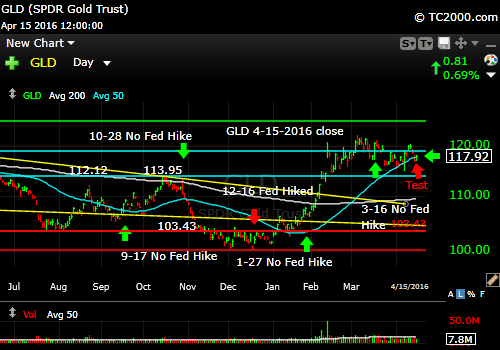
Gold can still be bought on these pullbacks. The dollar is my concern.
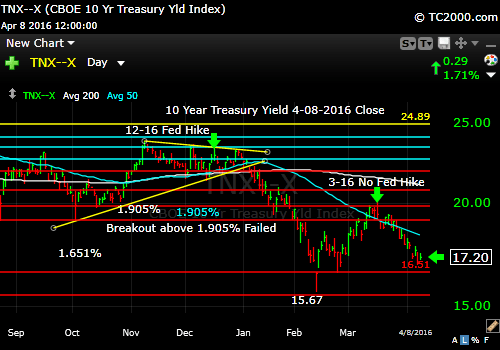
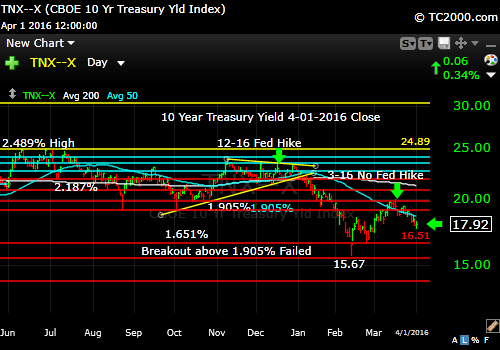
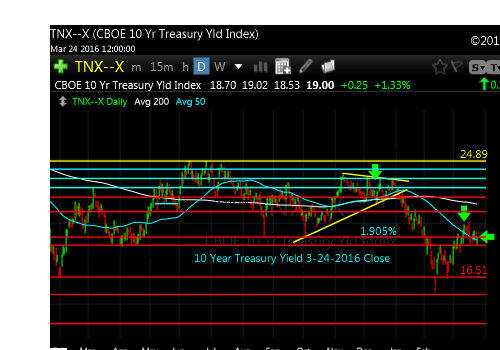
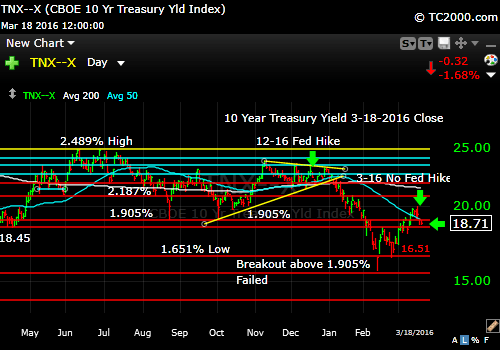
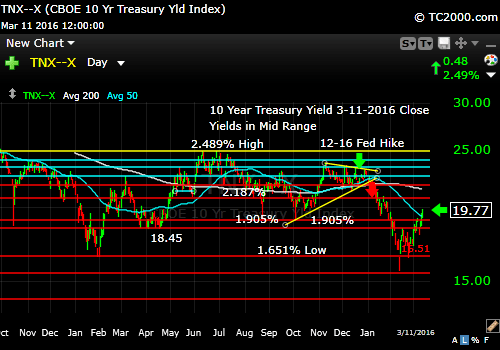
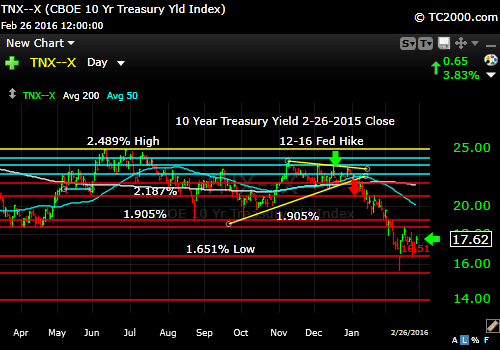
4. U.S. 10 Year Treasury Note Yield (TNX): Rates should head lower and could drive down the U.S. dollar unless we enter an international financial panic. In a panic, gold and the dollar go up and rates go down (bonds/Treasuries UP in value) as investors flee to U.S. Treasuries.
U.S. 10 Year Treasury Note Yield (click chart to enlarge; TNX,TYX,TLT,TBF):

Yields should fall further.
Stay with me throughout the week for the LATEST via the links to Twitter/StockTwits above. Feel free to comment, retweet etc. to spread the word.
Be sure to visit the website for more general investing knowledge at:
Standard Disclaimer: It’s your money and your decision as to how to invest it.
I thank Worden Brothers for the charting system I use to post these charts. If you want to know more about the charting system I use every day, go to my “Other Resources” page here: Other Resources It makes it much easier to follow along with me if you can see the charts and manipulate them on your own computer. It’s a great investment to have an excellent charting system. Check it out with a free trial at the link above.
Note that the newsletter is now CLOSED to new subscriptions: Join the Wait List to Join the Newsletter as a Loyal Subscriber, Opening again for the July 3rd issue. If you join and don’t read the newsletter, you will be deleted. Why? I don’t publish to non-readers as other newsletters do. I surround myself with committed people who value what we are doing. Stay tuned here in the meantime and follow all the action via the Twitter® and StockTwits® links above.
Copyright © 2016 By Wall Street Sun and Storm Report, LLC All rights reserved.