Market Timing Brief™ for the 12-04-2015 Close: SP500 Index Still Must Overcome Failed Breakout. Gold Shines from Depths of Despair as Rates Fall Friday.

A Market Timing Report based on the 12-04-2015 Close, published Sunday December 6th, 2015

I deliver focused comments on the markets.  These are supplemented with “Tweets/StockTwits” (see links below).

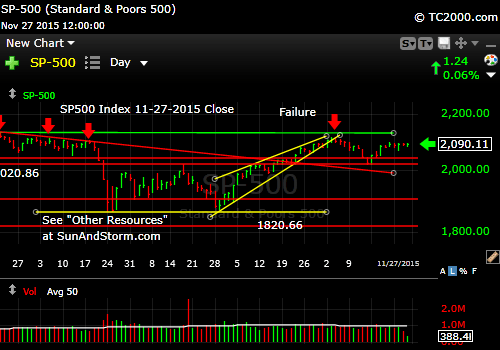
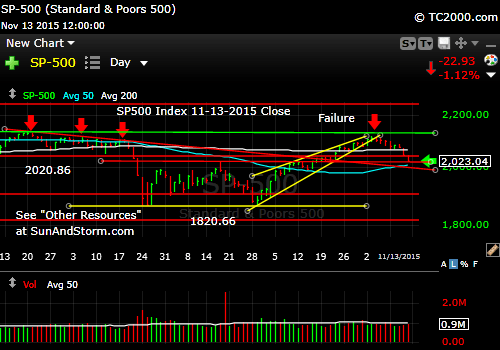
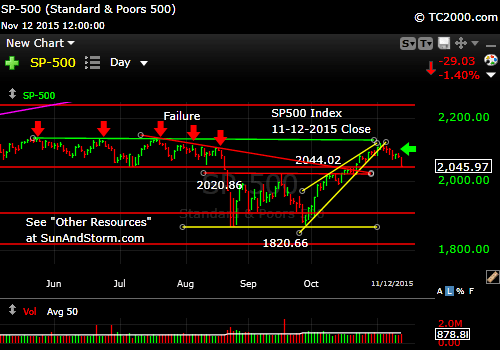
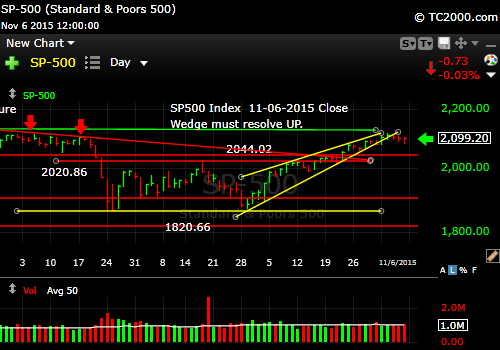
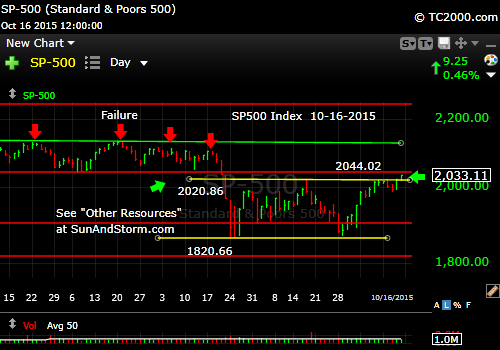
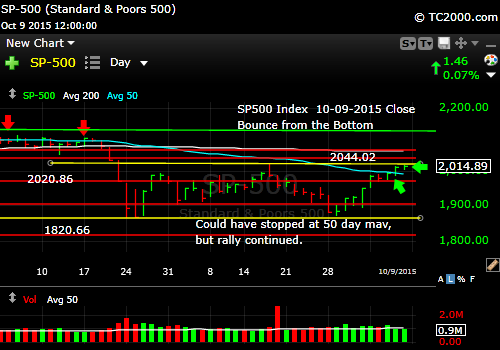
1.  SP500 Index: It’s still up and stuck.  The Fed is clearly going to hike the Fed Funds rate on December 16th after their mid-December meeting on the 15th and 16th.  We know this, because they have telegraphed it in a detailed way to the press.  Of course, they remain “data dependent.”  Only Retail Sales on 12-11 and the Consumer Price Index on the morning of their first meeting day will be out in time to influence their decision.  I doubt they will sway them either way as there is plenty of data already out that suggests they should wait on hiking rates if they want to be internally consistent, and yet, they say they intend to raise rates.  Manufacturing is in a steady decline (see my social media links below to catch up) and ISM services was also weak in the last report.  Raising rates into a slowing economy and worldwide deflation is going to compound the problems we face (cont. below the chart).

SP500 Index Chart (click to enlarge; SPX, SPY):

sp500-index-market-timing-chart-2015-12-04-close

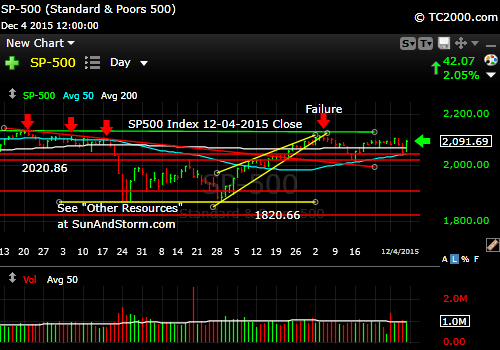
SP500 Index still stuck below a lower high and a failed minor breakout.

If the intention of the Federal Reserve is to drive us into a recession that finally bankrupts a number of companies that “should have” gone bankrupt in the last recession, but did not do so due to liberal Fed monetary policy, then it should stay the course.  The point is that tightening now is internally inconsistent with what they have been doing to date.

Is this move to higher rates being done to strengthen the banks, which it will?  Is it being done to reward the poor with a higher than zero savings rate?  The Fed has not had the interests of the poor in mind at any point since the decline began in 2007.  Why should they be interested now?  Guilt?  Not likely.  My money is with the idea that they are helping to strengthen the banks ahead of the next major recession that they ironically may create.

The Fed created the bubbles of 2000 and 2007.  It has aggravated our problems rather than curing them.  The excuse of “financial stability” only really meant to the Fed that they had to save Goldman Sachs et. al. from their own bad bets instead of allowing them to reorganize under the bankruptcy laws. 

The Fed WILL likely raise rates on December 16th.  What will the market do?  IF the market sees things picking back up in the economy, higher rates are just fine as they have been in other cycles as long as they are not overdone.  IF we are actually slipping closer to recession, raising rates could tip us over much faster into a deeper recession than we would see without Fed action.

Keep up to date at Twitter and StockTwits: See my messages on Twitter® Follow Me on Twitter®.   Follow Me on StockTwits®).

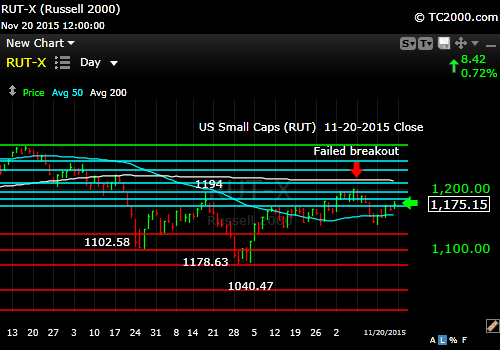
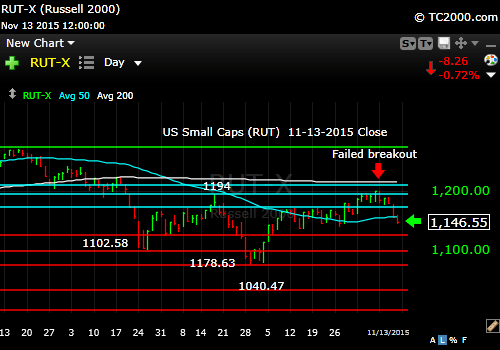
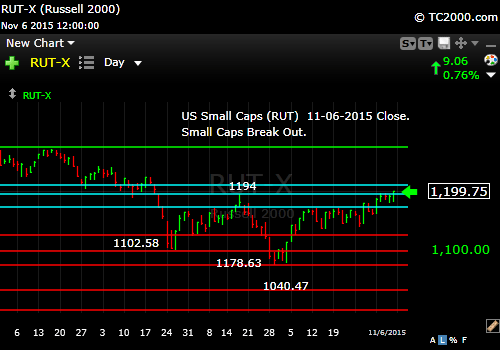
2. U.S. Small caps bounced a bit on Friday, but not to the degree large caps did. They still create more risk exposure than large caps do despite the possibility that a higher low is forming on the chart shown. There is still a failed breakout to get past at the high back in November.  The December attempt to break above that high failed. Stay clear of small caps as a group for now unless you have intimate knowledge of individual growth companies that you can substitute for the index.

Russell 2000 U.S. Small Cap Index (RUT, IWM; click to enlarge):

rut-small cap-index-market-timing-chart-2015-12-04-close

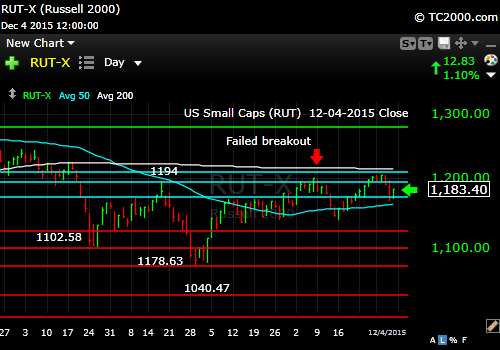
Friday was an inside day. We still have a failed breakout to account for.

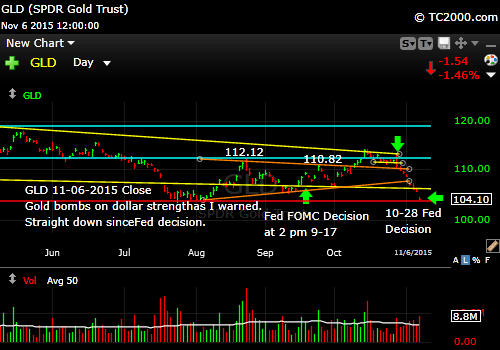
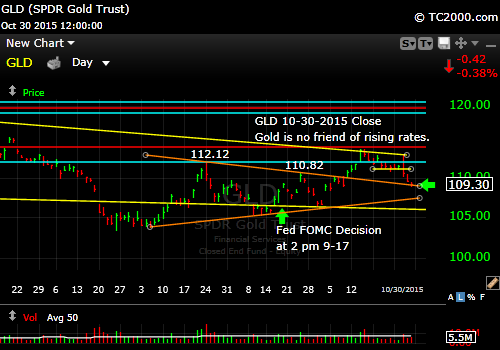
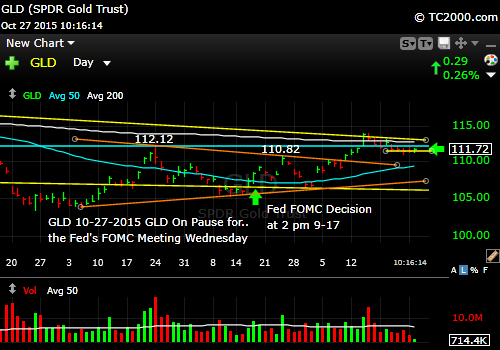
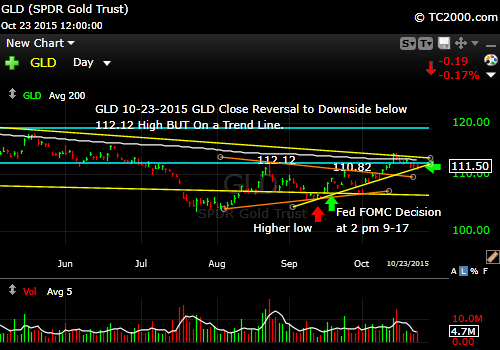
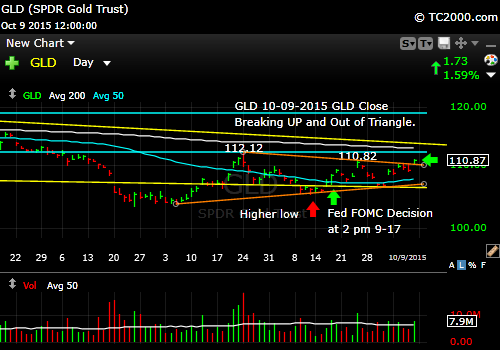
3. Gold had a major UPSIDE reversal on Friday. Gold (GLD) is now a trading buy with a sell stop on a close back below the July low.  Don’t put your stops in the market, or you may be picked off by the market makers/high frequency traders.

Gold ETF (GLD; click to enlarge):

gld-gold-etf-market-timing-chart-2015-12-04-close

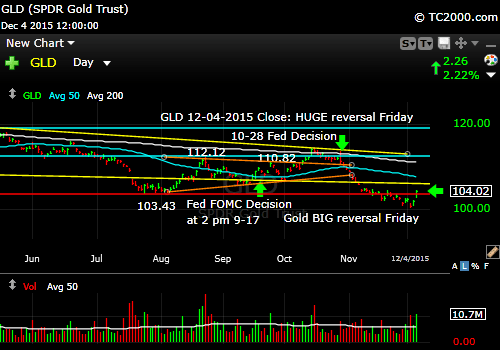
Gold has a major UPSIDE reversal.

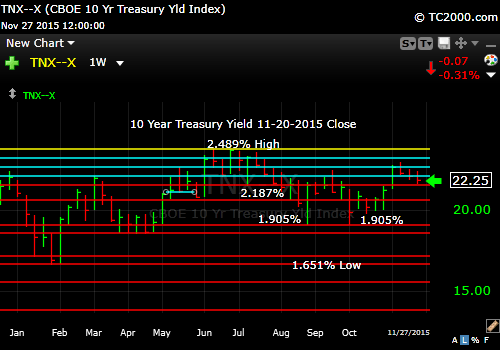
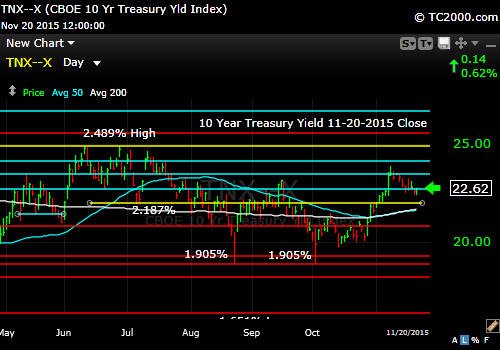
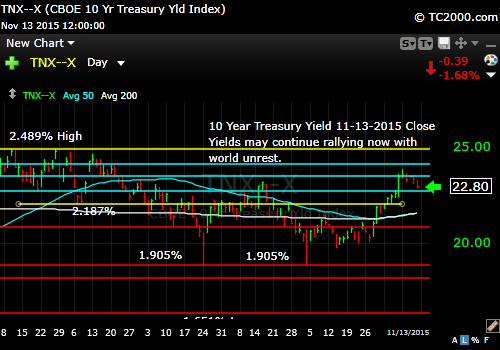
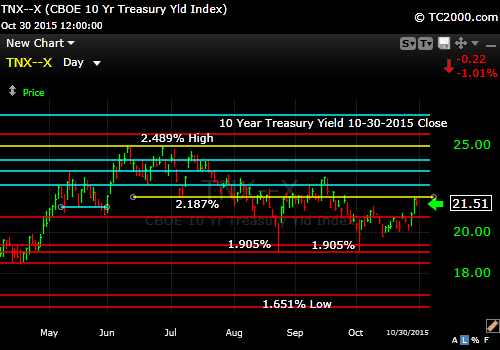
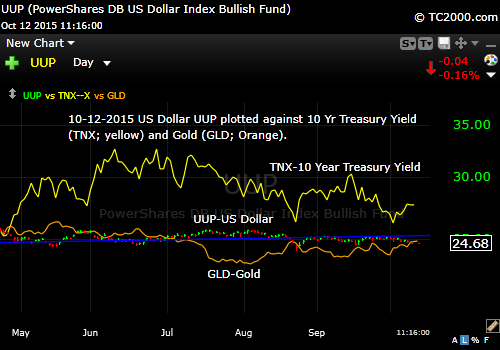
4. U.S. 10 Year Treasury Note Yield (click chart to enlarge; TNX,TYX,TLT,TBF): Rates FAILED an important breakout above the September high this past week – for the second time.  That bodes well for lower yields, but the tough issue that faces bond Bulls is that the Fed is about to increase rates at least 2 times per many observers and perhaps as many as 4-6 times.  This could make it difficult to see short term success in bonds.

Long term?  Longer term there is still a Central Bank threat of higher inflation that will absolutely clobber bond holders. I attended a private meeting held by an excellent management firm this past week, and their view was that we are looking at 2% returns for longer term bonds over the next 10 years.  That means we have to look to stocks for adequate returns and in the equity space focus on GROWTH stocks with solid stories that will hold up despite a sluggish economy.  Where we buy more equities is to be determined (check my Twitter/StockTwits feeds for my current exposure levels and recent purchases.)

tnx-10-year-treasury-note-market-timing-chart-2014-12-04-close

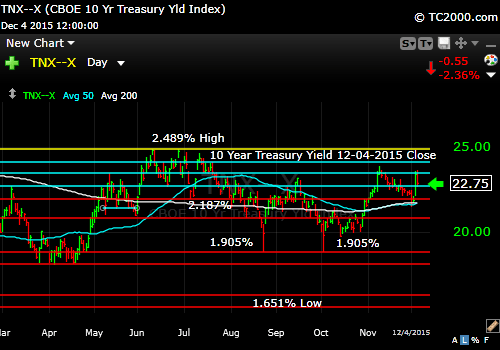
Rates failed an important breakout to the upside.

Be sure to visit the website at: Sun and Storm Investing™

Standard Disclaimer: It’s your money and your decision as to how to invest it.

I thank Worden Brothers for the charting system I use to post these charts.  If you want to know more about the charting system I use every day, go to my “Other Resources” page here:  Other Resources   It makes it much easier to follow along with me if you can see the charts and manipulate them on your own computer.  It’s a great investment to have an excellent charting system.  Check it out with a free trial at the link above.

Note that the newsletter is now CLOSED to new subscriptions: Join the Wait List to Join the Newsletter as a Loyal Subscriber, Opening again for the January 3rd issue. If you join and don’t read the newsletter, you will be deleted. Why? I don’t publish to non-readers as other newsletters do. I surround myself with committed people who value what we are doing. Stay tuned here in the meantime and follow all the action via the Twitter® and StockTwits® links above.

Copyright © 2015 By Wall Street Sun and Storm Report, LLC All rights reserved.

Posted in Bonds, gold, investment, large cap stocks, S&P 500 Index, small cap stocks, Treasuries | Tagged , , , , , , , , , , , , , , , , , , | Leave a comment

Market Timing Brief™ for the 11-27-2015 Close: SP500 Index is Up and Stuck. Gold Falls to New Recent Lows as Rates Slide Further.

A Market Timing Report based on the 11-27-2015 Close, published Sunday Nov. 29th, 2015

I deliver focused comments on the markets.  These are supplemented with “Tweets/StockTwits” (see links below).

I trust you had a wonderful Thanksgiving!  The markets will be back at it on Monday, so here are some brief comments about the markets to catch you back up to my current thinking…

1.  SP500 Index: Up and stuck.  Perhaps the market is waiting to see what U.S. holiday sales will look like.  The market is currently about mid-range, so it’s not a good place to add either longs or shorts.  If this bounce reverses at a lower high than the top of the wedge, the market will behave badly.

SP500 Index Chart (click to enlarge; SPX, SPY):

sp500-index-market-timing-chart-2015-11-27-close

Stuck.

Keep up to date at Twitter and StockTwits: See my messages on Twitter® Follow Me on Twitter®.   Follow Me on StockTwits®).

2. U.S. Small caps have outperformed large caps since the 2009 low, but have underperformed since the August low.  Investors are eyeing the door as the Federal Reserve has decided to raise rates in December, except of course, that they remain “data dependent.”  The data meanwhile are strong enough that the expectation for a Federal Reserve rate hike has gone up to 78% per the CME Group.

Russell 2000 U.S. Small Cap Index (RUT, IWM; click to enlarge):

rut-small cap-index-market-timing-chart-2015-11-27-close

Small caps still catching up.

3. Gold has finally broken down to a brand new low since the high in 2011.  This is what we expected.  The economic recovery scenario with rising rates is the one that will be most harmful to gold’s intermediate term prospects.

Gold ETF (GLD; click to enlarge):

gld-gold-etf-market-timing-chart-2015-11-27-close

Gold breaks down again!

4. U.S. 10 Year Treasury Note Yield (click chart to enlarge; TNX,TYX,TLT,TBF): Rates shown on the weekly chart below continue to slide despite the Fed threat of a hike or two.  This is because raising rates into deflation will just produce more of the same and bond yields will stay low. NOTE: the chart says 11-20, but in fact represents the 11-27-2015 close. 

tnx-10-year-treasury-note-market-timing-chart-2014-11-27-close

Rates keep slipping despite the threat of a rate hike. Guess why? (read text).

Be sure to visit the website at: Sun and Storm Investing™

Standard Disclaimer: It’s your money and your decision as to how to invest it.

I thank Worden Brothers for the charting system I use to post these charts.  If you want to know more about the charting system I use every day, go to my “Other Resources” page here:  Other Resources   It makes it much easier to follow along with me if you can see the charts and manipulate them on your own computer.  It’s a great investment to have an excellent charting system.  Check it out with a free trial at the link above.

Note that the newsletter is now CLOSED to new subscriptions: Join the Wait List to Join the Newsletter as a Loyal Subscriber, Opening again for the January 3rd issue. If you join and don’t read the newsletter, you will be deleted. Why? I don’t publish to non-readers as other newsletters do. I surround myself with committed people who value what we are doing. Stay tuned here in the meantime and follow all the action via the Twitter® and StockTwits® links above.

Copyright © 2015 By Wall Street Sun and Storm Report, LLC All rights reserved.

Posted in Bonds, gold, investment, large cap stocks, S&P 500 Index, small cap stocks, Treasuries | Tagged , , , , , , , , , , , , , , , , | Leave a comment

Market Timing Brief™ for the 11-20-2015 Close: SP500 Index Crawling Back Toward the All Time High. Gold Holding On In An Odd Place. Rates Soften Ahead of a Fed Rate Hike.

A Market Timing Report based on the 11-20-2015 Close, published Monday Nov. 23th, 2015

I deliver focused comments on the markets.  These are supplemented with “Tweets/StockTwits” (see links below).

1.  SP500 Index: The index may head all the way back to the prior high.
If the economy improves and the next employment report out in early December is as strong as the last one, proving that it was not a fluke, the market can make new highs.  If however, the retail stocks (DOWN big except for Amazon (AMZN) and a few others) are correct and there is trouble ahead for the holiday shopping season, then the market should fail, even if it makes a marginal new high above the prior all time high.

We’ll follow the economy closely.  It’s more important now than what the Federal Reserve can do.  All they are doing is raising rates at the margin into worldwide economic weakness, which could even land us in a recession or at least push us toward it.  The economy is where we need to focus…

sp500-index-market-timing-chart-2015-11-20-close

Clawing back to the all time high?

Keep up to date at Twitter and StockTwits: See my messages on Twitter® Follow Me on Twitter®.   Follow Me on StockTwits®).

2. U.S. Small caps are bouncing with large caps but not to the same extent, as you see on the chart below.  We are staying long large caps and largely avoiding small and mid cap stocks, but at a lower level of exposure (see Twitter/StockTwits for my exposure level; links above).

Russell 2000 U.S. Small Cap Index (RUT, IWM; click to enlarge):

rut-small cap-index-market-timing-chart-2015-11-20-close

Small caps still trailing large caps.

3. Gold is at a 5 year low testing BELOW a critical support level. Gold is holding up in a strange place, which is JUST BELOW a critical support level.  This is Bullish.  But use a stop if you trade it.  I don’t like gold right now for a trade, but will like it if the dollar stops gaining strength as the market recognizes that the Fed won’t be able to raise rates much at all.  We are not in the gold trade, and only hold gold for currency insurance.  If you trade it, be sure to use a stop.

Gold ETF (GLD; click to enlarge):

gld-gold-etf-market-timing-chart-2015-11-20-close

Gold is consolidating below support.

4. 10 Year Treasury Note Yield: Yields staged a false breakout recently (did not maintain a high higher than the prior major daily high), and should head lower unless we see an outstanding holiday season and continued job growth.  If things remain weak worldwide, bonds and Treasuries should rally further.

U.S. 10 Year Treasury Note Yield (TNX,TYX,TLT,TBF):

tnx-10-year-treasury-note-market-timing-chart-2014-11-20-close

Rates should fall further as the Fed raises rates unless economic activity and retail sales pick up further in the U.S.

Be sure to visit the website at: Sun and Storm Investing™

Standard Disclaimer: It’s your money and your decision as to how to invest it.

I thank Worden Brothers for the charting system I use to post these charts.  If you want to know more about the charting system I use every day, go to my “Other Resources” page here:  Other Resources   It makes it much easier to follow along with me if you can see the charts and manipulate them on your own computer.  It’s a great investment to have an excellent charting system.  Check it out with a free trial at the link above.

Note that the newsletter is now CLOSED to new subscriptions: Join the Wait List to Join the Newsletter as a Loyal Subscriber, Opening again for the January 3rd issue. If you join and don’t read the newsletter, you will be deleted. Why? I don’t publish to non-readers as other newsletters do. I surround myself with committed people who value what we are doing. Stay tuned here in the meantime and follow all the action via the Twitter® and StockTwits® links above.

Copyright © 2015 By Wall Street Sun and Storm Report, LLC All rights reserved.

Posted in Bonds, gold, investment, large cap stocks, S&P 500 Index, small cap stocks, Treasuries | Tagged , , , , , , , , , , , , , , , , , , , , | Leave a comment

Market Timing Brief™ for the 11-13-2015 Close: SP500 Index Under Pressure Even Before Paris Attacks. Gold In the Basement. Rates Falling Again.

A Market Timing Report based on the 11-13-2015 Close, published Sunday Nov. 15th, 2015

I deliver focused comments on the markets.  These are supplemented with “Tweets/StockTwits” (see links below).

We must stand in solidarity with the French people following the Paris attacks, but at the same time, we must remain conscious in regard to our investments.

1.  SP500 Index: The world is now in crisis-response mode, and we have to face the possible effects of this on the economy.  Despite the fact that those visiting shopping malls in smaller cities around the nation may feel safe, those in larger cities may not, following the 3 terrorist attacks by ISIL on Russia (the plane downing), Lebanon (two bombings) and now Paris  that were fairly sophisticated in terms of planning.  This could effect consumer behavior including the willingness to board planes depending on the destination.  A rate hike by the Federal Reserve may be pushed off into the future in light of the further slowing that could occur.

We are already in a war with ISIL according to the President, despite the administration’s willingness to pursue it entirely from the air and with a few advisors.  It really depends on whether the rhetoric changes whether this starts to feel like more of a war.  After 911 which this resembles for France, our market dropped 4.92% after a week of cleanup on Wall Street.  This is not likely going to be taken with quite the same level of fear in the U.S., so the losses may be lighter than that; however, I believe we’ll hit the targets I shared on Twitter/StockTwits last week in short order (1990-2008).  2020.86 was immediate support, but that was lost afterhours on Friday after the Paris attacks.

Fortunately, we’ve lightened up a bit and have extra cash to buy at lower prices.  If some of you read my calls and became more liquid than I did, that is great (I’ve gone from 135% of usual maximum equity exposure worldwide back in February 2015 to 94% as of Friday).

sp500-index-market-timing-chart-2015-11-13-close

SP500 Index fails again at a top and is breaking an important Bearish wedge.

Keep up to date at Twitter and StockTwits: See my messages on Twitter® Follow Me on Twitter®.   Follow Me on StockTwits®).

2. Small caps have reversed the prior breakout.  They are again a “sell” in my opinion.

Russell 2000 U.S. Small Cap Index (RUT, IWM; click to enlarge):

rut-small cap-index-market-timing-chart-2015-11-13-close

Small caps fail a breakout.

3. Gold is on its knees. The unrest in the world may drive it up for a while.  We’ll know soon when trading begins.  If you buy here, you must use a stop, and I’d go further to say that if gold does not pop when trading opens tonight, the prospects for it are not good until rates fall and the Fed backs off.

Gold ETF (GLD; click to enlarge):

gld-gold-etf-market-timing-chart-2015-11-13-close

Gold at a major low. Must rally immediately and it may based on world unrest.

4. 10 Year Treasury Note Yield: I’ll stick to what I said last week with an added dose of concern over the world’s economy slowing given the terrorism fears that have now been heightened and are likely to weigh on commerce.  Longer term, UNLESS the Fed is actually behind on inflation (doubtful), rates should DROP again.

The wild card however is OIL!  If there is fear about oil supplies being compromised in the Middle East, and oil prices start to rise, watch out, because inflation will rise and push core inflation higher over time.  This is the reverse of what’s been happening on the way down for oil.  That would put the Fed in a box with higher inflation and slower growth, none other than stagflation.

U.S. 10 Year Treasury Note Yield (TNX,TYX,TLT,TBF):

tnx-10-year-treasury-note-market-timing-chart-2014-11-13-close

Rates eased a bit lower. The terror could push them further down in the range.

Be sure to visit the website at: Sun and Storm Investing™

Standard Disclaimer: It’s your money and your decision as to how to invest it.

I thank Worden Brothers for the charting system I use to post these charts.  If you want to know more about the charting system I use every day, go to my “Other Resources” page here:  Other Resources   It makes it much easier to follow along with me if you can see the charts and manipulate them on your own computer.  It’s a great investment to have an excellent charting system.  Check it out with a free trial at the link above.

Note that the newsletter is now CLOSED to new subscriptions: Join the Wait List to Join the Newsletter as a Loyal Subscriber, Opening again for the January 3rd issue. If you join and don’t read the newsletter, you will be deleted. Why? I don’t publish to non-readers as other newsletters do. I surround myself with committed people who value what we are doing. Stay tuned here in the meantime and follow all the action via the Twitter® and StockTwits® links above.

Copyright © 2015 By Wall Street Sun and Storm Report, LLC All rights reserved.

Posted in Bonds, gold, investment, large cap stocks, S&P 500 Index, small cap stocks, Treasuries | Tagged , , , , , , , , , , , , , , , , , , | Leave a comment

Market Timing Brief™ for the 11-06-2015 Close (UPDATED 11-12-2015): SP500 Index Reacts Well After Strong Employment Numbers (then BREAKS). Gold Suffers on Rapidly Rising Interest Rates.

A Market Timing Report based on the 11-06-2015 Close, published Sunday Nov. 8th, 2015

UPDATE 11-08-2015: At the Bottom of the SP500 Index Range

Take a look at where the market stopped today.  The wedge is broken, yes, and that could bring more pain (read up on my targets on Twitter/StockTwits).  We are just about 2 points from the bottom of one of the ranges that has been in play. If the retail numbers are consensus, the market could rally.  Too strong or too weak may favor the Bears.  Watch to see if that 2044.02 number holds tomorrow after we hear about retail sales at 8:30 a.m. ET.

Click the chart to enlarge it:

sp500-index-market-timing-chart-2015-11-12-close

Bottom of a recent trading range.

And now back to this week’s full report.

I deliver focused comments on the markets.  These are supplemented with “Tweets/StockTwits” (see links below).

1.  SP500 Index:  It was an exciting week for the markets with an overly strong employment report of 271,000 jobs when 190,000 were expected by Bloomberg NewsYet the stock market did fine afterward with the NASDAQ 100 up slightly for the day and the SP500 Index pulling back only slightly (-0.03%) after a deeper dip earlier in the day on Friday.  I believe the market is starting to view “good news as good news” rather than bad, which it had done until fairly recently.

IF the employment number is not a fluke, then GDP should be fine through year end, and the Federal Reserve WILL be raising rates in December.  Rising rates are not a problem as long as the Fed does not overdo it.  That is true historically.  Stock markets typically do OK with gradually rising rates.  Some say, the economy is different and the impact of higher rates on stock buybacks is bigger than people understand.  There are many cross currents, so we’ll remain vigilant.

Bears say things are much worse than the U.S. employment number this month says they are.  They claim GDP will turn negative sooner than expected should the Fed raises rates a few times in the next 6 months.  That means they are expecting a recession.  I won’t pick sides on that fight.  I’ll follow the charts.  I moved back up to 98% invested vs. my usual maximum equity exposure (follow this on Twitter/StockTwits as it changes and it can dramatically within days), because buying in the U.S. market still looks good.

IF the wedge shown in the chart below should break, there would be another serious dip at least prior to potential recovery into year end.  I am not in the business of making predictions beyond what is happening now.  Why?  A 911 can change market conditions on a dime; so can a Japanese tsunami.  We could get that last big pullback as we did in the 2011 market that this pullback has resembled in many ways.  It’s better to follow the markets rather than follow the dreams of Bulls and Bears who are ego-invested in the outcome they are predicting.  We won’t indulge in ego-based thinking.

SP500 Index (SPX SPY; click to enlarge): You can see that for the last few days, all we have had is a simple consolidation.  I’d say the bias is UP at the moment especially given the small cap confirmation noted in the next chart below.

sp500-index-market-timing-chart-2015-11-06-close

SP500 must not break the wedge, but what it did after the employment report was fine – it stayed in the consolidation.

Keep up to date at Twitter and StockTwits: See my messages on Twitter® Follow Me on Twitter®.   Follow Me on StockTwits®).

2. Small caps broke above the mid-Sept. high.  This is very Bullish for the entire U.S. market.  We’re staying long for now.

Russell 2000 U.S. Small Cap Index (RUT, IWM; click to enlarge):

rut-small cap-index-market-timing-chart-2015-11-06-close

Small caps DO catch up a bit finally. Positive.

3. Gold did horribly as I said would happen if a Fed rate hike became more likely.  Stay away.  I hope you took profits.  If not, you learned something.  Don’t be fooled next time or try not to be! 

What could be the reason for yet another break in gold’s buying support?  Remember that the strong economy (if it’s still true when we get next month’s number) is also bad for gold, because productive assets like stocks are favored over non-productive assets like gold when the earnings strengthen.  Earnings have recently weakened, but the employment numbers were a hint that things may be picking up once again.  Watch your stops.

Gold ETF (GLD; click to enlarge):

gld-gold-etf-market-timing-chart-2015-11-06-close

Gold punished by strong dollar/rising rates after Fed and employment number.

4. 10 Year Treasury Note Yield: Longer term, UNLESS the Fed is actually behind on inflation (doubtful), rates should DROP again.  So we may have to be patient and endure some bond pain back up to the 2.489% level or higher.

If oil prices start to rise, watch out though, because rates can go up a lot faster on pricier oil.  If the economy is actually slowing down and Friday’s employment number was a fluke, rates will come down again and bonds/Treasuries will rally in price.

For now, we have a new upside breakout in rates on our hands.  Stay clear of all highly interest rate sensitive ETFs like utilities until the smoke clears.  It has not yet cleared!  If you want to get fancy and trade the extremes from day to day, go ahead, but be sure to take profits fast.

U.S. 10 Year Treasury Note Yield (TNX,TYX,TLT,TBF):

tnx-10-year-treasury-note-market-timing-chart-2014-11-06-close

10 Year Note looks headed to 2.489%. Not good for bond holders.

Be sure to visit the website at: Sun and Storm Investing™

Standard Disclaimer: It’s your money and your decision as to how to invest it.

I thank Worden Brothers for the charting system I use to post these charts.  If you want to know more about the charting system I use every day, go to my “Other Resources” page here:  Other Resources   It makes it much easier to follow along with me if you can see the charts and manipulate them on your own computer.  It’s a great investment to have an excellent charting system.  Check it out with a free trial at the link above.

Note that the newsletter is now CLOSED to new subscriptions: Join the Wait List to Join the Newsletter as a Loyal Subscriber, Opening again for the January 3rd issue. If you join and don’t read the newsletter, you will be deleted. Why? I don’t publish to non-readers as other newsletters do. I surround myself with committed people who value what we are doing. Stay tuned here in the meantime and follow all the action via the Twitter® and StockTwits® links above.

Copyright © 2015 By Wall Street Sun and Storm Report, LLC All rights reserved.

Posted in Bonds, gold, investment, large cap stocks, S&P 500 Index, small cap stocks, Treasuries | Tagged , , , , , , , , , , , , , , , , , | Leave a comment

Market Timing Brief™ for the 10-30-2015 Close (UPDATE 11-05-2015-Market Ready to Crack Again?): SP500 Index Testing a Bearish Wedge. Gold Weak On Rising Rates.

A Market Timing Report based on the 10-30-2015 Close, published Monday Nov. 2nd, 2015

UPDATE 11-05-2015: Survey Says! And Why The Market May Break Down Again
I’ll tell you why AAII.com Individual Investory Sentiment is negative this week.  It’s because the market went up and drew in hardly any new Bulls.  The Bull – Bear spread went from 19.8% to 20.4%, barely moving up on the rally.  And now we’re in a consolidation chartwise just prior to the employment report this Friday the 6th. This means we have higher prices and no new Bulls to sustain the rally.  At least not now.  That’s why I’ve reduced my exposure as mentioned on social media (links below).

The employment situation report could be weak again as it surprised on the weak side last month.  Last month we only had 142,000 new jobs vs. expectations of economists for 190,000 new jobs for Friday’s report on October employment.  Click on the employment situation link HERE and you’ll see that job creation peaked and is falling. 

The danger is not a slightly weak report.  That would likely be viewed favorably, because it allows the Fed to not hike in December.  The danger is a VERY weak report relative to expectations, which could be finally seen as “bad is bad,” rather than the previous sense of the market that “bad is good” because it holds off a rate hike. 

Now I will admit that in the short term (weeks), a very weak employment report could be seen as “good” in that the Fed won’t be able to hike as a result, but over the intermediate terms (months), it could mean the economy is headed into a recession.  Eventually “bad is bad” if the economy slows.  Recessions are Bull market killers.  We may not see one anytime soon, but some believe we will and that the slowing is accelerating from the 42 year employment peak we reached. 

The other danger is a report that is far too strong vs. expectations.  Anything above 250,000 would not be taken well, as it would mean that the Fed could be falling behind on raising rates and that it will therefore hike interest rates in December.

Either of the negative scenarios that I outlined above would potentially break the upward Bearish wedge I show in the first chart below.  The break point is SPY 208.17 and SPX 2080.76 for me. 

A break below there could cause a strong acceleration of selling with the SP500 Index reaching what could be a full retest of the most recent daily low, perhaps lower.  Looking back to the 2011 scenario which this has resembled (and I believe I was one of the first to point this out prior to being discussed on CNBC), there was a very significant dip in November prior to the rally into year’s end.  I’m sensing the same could happen this November.

Now back to this week’s report….

I deliver focused comments on the markets.  These are supplemented with “Tweets/StockTwits” (see links below).

1.  SP500 Index:  As pointed out on Friday, the SP500 Index has formed a Bearish upward wedge, and if it breaks please refer to the prior update for the target to which it will fall most likely.  GDP was weak at 1.5% this past week.  That is an annualized projection down big from a robust prior results of 3.9%.  That is a huge deceleration and some say will lead us into a recession.  We will follow the markets, which represents the sum total consciousness of all economic data among other myriad influences.  We try not to get too far ahead of ourselves by making “predictions,” but there is certainly room to run to 2126-2134 if the Bulls want it.  Stay tuned with me throughout the week on social media (links below).

SP500 Index (SPX SPY; click to enlarge):

sp500-index-market-timing-chart-2015-10-30-close

SP500 Index must break up out of the wedge.

 As of the close Monday, the SPX is well up into the wedge, but must move up through the top yellow line.  If it breaks the other way, the warnings I made apply.

Keep up to date at Twitter and StockTwits: See my messages on Twitter® Follow Me on Twitter®.   Follow Me on StockTwits®).

2. Small caps remain behind large caps in this rally, but the Monday buying is stronger and is encouraging for the overall market.  They are up about double large caps today.

UPDATE after Monday close: 1194 is the next challenge.  The strength in the small caps along with the large caps is encouraging for the Bull case.

Russell 2000 U.S. Small Cap Index (RUT, IWM; click to enlarge):

rut-small cap-index-market-timing-chart-2015-10-30-close

Small caps still lag large caps.

3. Gold is doomed to weakness when rates rise and drive the US dollar up.  Added to that misery was organic gold selling on “up dollar” days.

Gold ETF (GLD):

UPDATE 11-03-2015: GLD is below the lower orange line shown below and on its way to test 106, which is the lower yellow trend line representing the lower trend line forming the big downward wedge, which in itself is Bullish.  The buying range would be 105.27 to 106. 

I’d use a stop for a close below that support personally, but have your own plan.  If the dollar keeps rallying, this gold trade won’t work out.   I believe the Fed will be truly dumb to raise rates into a worldwide slowdown, but when have government organizations been consistently smart?  Gold will eventually rally as the truth dawns on the markets that the Fed won’t be able to raise rates much at all.  And if they do, all HECK will break loose in the markets as we slide into a Fed created recession.

gld-gold-etf-market-timing-chart-2015-10-30-close

Gold failed a big breakout attempt and is skidding on higher rates in view of the possible rate hike in Dec.

UPDATE after Monday Close: Gold was down and so were Treasuries.  The latter stopped right at the 2.187% resistance line.  No coincidence.  Fear of the Fed could push rates even higher however (and Treasury prices down).

4. 10 Year Treasury Note Yield: Rates rose a bit on the Fed hike risk increase.   They should theoretically fall if the Fed is wrong on inflation.  Raising rates into deflation could induce a full economic recession, not just the earnings recession we’ve witnessed to date.  Rates should therefore remain in a range.  When rates are high, buy TLT and when they are low sell it!  I decreased the size of my position a bit and am more focused on municipal bonds for income at the moment.

U.S. 10 Year Treasury Note Yield (TNX,TYX,TLT,TBF):

tnx-10-year-treasury-note-market-timing-chart-2014-10-30-close

Rates rise on Fed rate hiking fear.

Be sure to visit the website at: Sun and Storm Investing™

Standard Disclaimer: It’s your money and your decision as to how to invest it.

I thank Worden Brothers for the charting system I use to post these charts.  If you want to know more about the charting system I use every day, go to my “Other Resources” page here:  Other Resources   It makes it much easier to follow along with me if you can see the charts and manipulate them on your own computer.  It’s a great investment to have an excellent charting system.  Check it out with a free trial at the link above.

Note that the newsletter is now CLOSED to new subscriptions: Join the Wait List to Join the Newsletter as a Loyal Subscriber, Opening again for the January 3rd issue. If you join and don’t read the newsletter, you will be deleted. Why? I don’t publish to non-readers as other newsletters do. I surround myself with committed people who value what we are doing. Stay tuned here in the meantime and follow all the action via the Twitter® and StockTwits® links above.

Copyright © 2015 By Wall Street Sun and Storm Report, LLC All rights reserved.

Posted in Bonds, gold, investment, large cap stocks, S&P 500 Index, small cap stocks, Treasuries | Tagged , , , , , , , , , , , , , , , , , | Leave a comment

Market Timing Brief™ for the 10-28-2015 Close (Updated 10-29 and 10-30 w SP500 Charts): Fed Statement Changes Reveal Upgrade in Hiking Bias

A Market Timing Report based on the 10-28-2015 Close, published Wednesday Oct. 28th, 2015

10-30-2015 UPDATE: Wedge Must Resolve to the UPSIDE!  If the wedge resolves to the downside we’ll easily fall back to 2044 or even back to the 2020.86 high of 9-17-2015.  Classically the resolution can be all the way back to the base of the wedge, which means a full retest.  I don’t see that in the near term.  My view is that we can make it back to the prior all time high.  If we get there quickly or even break out above there too quickly, we could see a larger correction as payback.  It’s far healthier for the market to ease back, move up etc. than to rush back to the highs or beyond.  Stay with me on Twitter/StocksTwits and we’ll navigate this together!    Follow Me on Twitter®.   Follow Me on StockTwits®).

If you have questions, shoot them to me on either of the two platforms, StockTwits or Twitter at the above links!

sp500-market-timing-chart-2015-10-30-948am

Wedge has formed moving up and must resolve UP not down!

10-28-2015  UPDATE AFTER POST FED DECISION RALLY:

We’re headed to 2126 (the down trend line) up to 2134.71, the all time high.  That is the next resistance for the market and I believe we’ll get there before this rally corrects. Take a look at the chart (SPX, SPY):

sp500-sector-market-timing-chart-2015-10-28-close

The down trend line shown and the all time high now act like magnets for traders.

Now here are the changes in the Fed FOMC Statement from September to October.  (Thanks go to MSFT for the comparison study shown below):

Fed changes from Sept. to Oct. Page 1

Fed changes from Sept. to Oct. Page 1

THIS was the big news today…that drove the bank rally.  They are now more biased toward raising rates in December.

Fed FOMC Statement Page 2

Comparison of October statement vs. Sept. 2015.

There were no changes after that…(see my further comments below). Jeffrey Lacker dissented again, wanting to raise rates by 0.25%.

Fed FOMC Comparison Page 3

FOMC Statement comparison between Sept and October 2015 statements.

It is very clear that the change from “maintain this target range” [target range has been 0.0%-0.25%] to “raise the target range at its next meeting” implies their INCREASING bias toward raising interest rates in December.  The futures markets showed a 47% likelihood of a rate hike in December, so numerous market participants are NOT in agreement with the Fed’s current economic viewpoint and see it as coming down in the near term.  Later the futures market was predicting odds of a Dec. hike at 44%, just slightly lower but still well above the 31% or so registered last week.

Remember that the Fed says repeatedly that it is “Data Dependent,” so they may well change their mind as 50% of market participants now believe they will. 

The Fed also removed the language that stressed a higher than normal concern about events outside the U.S.  They are restricting their focus on the U.S. data.  That’s what they are indicating.

GDP is out tomorrow (1st look; there are 3 different reports of GDP each quarter).  If it is consensus of about 1.7% per @BloombergNews, the market should be fine.  If it is far too weak, bad may no longer be “good” as the market sees it and the SP500 Index (SPY,SPX) will likely sell off. 

ANSWER (10-30-2015 Update and see Twitter/StockTwits): GDP was down big to 1.5% vs. 1.7% expected per Bloomberg.com.   Still, it is enough to allow the market to move higher on a Q4 recovery theory. 

Be sure to visit the website at: Sun and Storm Investing™

FULL FED FOMC Statement is: HERE

Standard Disclaimer: It’s your money and your decision as to how to invest it.

I thank Worden Brothers for the charting system I use to post these charts.  If you want to know more about the charting system I use every day, go to my “Other Resources” page here:  Other Resources   It makes it much easier to follow along with me if you can see the charts and manipulate them on your own computer.  It’s a great investment to have an excellent charting system.  Check it out with a free trial at the link above.

Note that the newsletter is now CLOSED to new subscriptions: Join the Wait List to Join the Newsletter as a Loyal Subscriber, Opening again for the January 3rd issue. If you join and don’t read the newsletter, you will be deleted. Why? I don’t publish to non-readers as other newsletters do. I surround myself with committed people who value what we are doing. Stay tuned here in the meantime and follow all the action via the Twitter® and StockTwits® links above.


Copyright © 2015 By Wall Street Sun and Storm Report, LLC All rights reserved.

Posted in Bonds, gold, investment, large cap stocks, S&P 500 Index, small cap stocks, Treasuries | Tagged , , , , , , , , , | Leave a comment

Market Timing Brief for the 10-23-2015 Close (10-27-2015 Update On Gold): “2011 Redo” Bounce for Large Caps. Small and Mid Caps Lag. Gold Slips as Rates Rise.

A Market Timing Report based on the 10-23-2015 Close, published Sunday Oct. 25th, 2015

UPDATE 10-27-2015: Gold On Pause for…? (click chart to magnify)

See the five day pause near the green arrow at the right? Gold is waiting for the Fed as GLD could have easily broken down having failed to hold the breakout above 112.12.  In my opinion, gold’s next move is likely UP unless the Fed raises rates prematurely at the meeting this week.  That would send gold down sharply.  I consider a Fed hike possible, but unlikely, due to the slowing we’ve seen in U.S. earnings and revenues as reported thus far during the current earnings season – both are negative.  I believe the Fed wants this Christmas season to be a recovery period for U.S. GDP and a rate hike would prevent that from happening.

gld-etf-market-timing-chart-2015-10-27-1016am

Gold is on pause just below a resistance level for the Fed announcement.

I deliver focused comments on the markets.  These are supplemented with “Tweets/StockTwits” (see links below).

1.  SP500 Index: Our 2011 Scenario continues to unfold, and as I said on Monday, the market has been “healed” volatility-wise.  In other words, things got very dicey quickly and that tension has now dissipated faster than they could say “Cover my shorts!” The Bears have been absolutely wiped out.  It doesn’t mean they cannot reappear, but wrong is wrong.

You can now set stops fairly close to the all time highs, which may be a wise decision.  If you sell and you are wrong, be willing to get back in.  Make your stops mental; never put stops in the market and make it easy for market makers and wild computers to make a fool out of you.  I raised a bit more cash during the rally to keep my exposure down to 90% of my usual maximum equity exposure worldwide with about 60% of that is in the U.S.  That gives me plenty of upside and some room to invest more aggressively on another pullback.

If you have had a tendency to SELL LOW and BUY HIGH, stop it already!  Decide to act differently and start buying as we just did near the lows.  It pays.

That said, the easy part of the rally is now over, so buying now should only be done on a slower averaging in basis, as we may see the market sell off once again to a higher low as it did in 2011.  I think the market also loved the performance of Secretary Clinton this week, who made the House Benghazi Committee Chair Gowdy look silly along with his colleague Congressman Jim Jordan who kept asking the same questions of her over and over.  Even if you don’t like Hillary, her opposition looked partisan, and the public realized that.  The country is tired of the blame game on BOTH sides.  As a true independent, I’d ask whether it’s better for us to get on with the business of the country than be bogged down in partisan bickering?

The stock market (with some exceptions, noted) loves the idea of a re-Clinton or a Trump or even a Carson.  Hillary’s performance served to dispel worries that she would be bogged down in the muck, and she picked up points immediately from self-proclaimed Socialist Congressman Sanders.  Wall Street celebrated.

That does not mean that biotech and drugs are off Hillary’s hook, as I pointed out on social media.  They have not participated in the rally.  I would stay clear of those names or certainly not overweight them.  Valuation based on lower pricing of their products will continue to be the worry.  What is a drug company worth if you halve the price of each expensive drug they sell?  That’s why companies like Gilead sell for such low multiples.  It’s not over either…

Notwithstanding focal blow ups, the big caps did very well this week. Next stop is 2128-2134.28, the all time high.  All time is a long time.  So I hear. 😉

SP500 Index (SPX SPY; click to enlarge):

sp500-market-timing-chart-2015-10-23-close

Big Caps Rule

So what are the BIG BUTS?

Keep up to date at Twitter and StockTwits: See my messages on Twitter® Follow Me on Twitter®.   Follow Me on StockTwits®).

2. What shows up in our charts this week is that neither the mid caps nor the small caps have bounced as well as the large cap stocks, some of which were up over 10% in one day such as MSFT.  They are harder for large funds to get out of quickly, but what happened in 2011?  The small and mid caps moved right back up with the large caps.  If they don’t catch up this time, it is a bad prognostic sign for the large caps holding their gains.  Note that both the RUT and MID have failed to recover above their 9-17-2015 highs and 200 day moving averages as the large caps have.

Russell 2000 U.S. Small Cap Index (RUT, IWM; click to enlarge):

rut-small-cap-index-market-timing-chart-2015-10-23-close

Small caps lag large caps.

Here is the lag in the Mid-Cap Recovery (MID, IJH)?

mid-cap-market-timing-chart-2015-10-23-close

U.S. Mid Caps lag large along with Small Caps.

3. Gold: I believe U.S. rates can come down more as we found out that the ECB is going to ease more in December (and if they don’t, all heck will break loose in Euroland) and the Chinese also eased this week (see FXI chart below).  If rates come down in the U.S., the dollar will weaken and gold will RISE in U.S. dollar terms.

The crosswind in favor of gold in all currencies is organic gold buying by nervous Europeans, Japanese, and Chinese who mistrust their countries moves to devalue their currencies.  I believe gold can hold to the recent range it’s been in, but again, preserve trading profits as they can be elusive.  The positive technically is that GLD is sitting on a weak support line (it’s a bit of an odd trend line as I’m excluding two points just below the middle of the line), but it must hold and I don’t like the way gold closed on Friday.

Gold ETF (GLD):

gld-etf-market-timing-chart-2015-10-23-close

Gold struggles as rates rise a bit, but sits near an up trend line.

4. 10 Year Treasury Note Yield: If U.S. GDP slows further, rates cannot stay as high as they are.  I believe that part of the rise in rates this week was a “risk off” phenomenon that has little to do with the intermediate term direction of U.S. interest rates.

U.S. 10 Year Treasury Note Yield (TNX,TYX,TLT,TBF):

tnx-10-year-treasury-note-market-timing-chart-2015-10-23-close

Rates rise, but the economy of the world is slowing despite monetary policy.

What’s the Bull thesis?  Easy monetary policy worldwide forces investors into stocks, even in China where all the worry has been about sub-7% growth, but look at the rally in Chinese stocks!  We’ll look to buy the pullbacks, and cut our losses if we are wrong.

fxi-china-market-timing-chart-2015-10-23-close

Chinese stocks outdo the naysayers.

What could cause a relapse of volatility? A Fed rate hike!  The Fed meets this week with the meeting ending on Wednesday without a news conference.  If the market has the sense that the Fed will raise in December or if they surprise the market by raising Fed rates this week, the stock markets will sell off as will the bond/Treasury markets. 

I believe October would be too soon for a Fed move, because it does not want a dollar headwind going into Q4, but don’t put a December rate hike past the Federal Reserve who now has a very nicely healed stock market as a backdrop and jobless claims just off a 42 year low.  What it lacks is robust worldwide growth.  In the end, the Fed may attempt a “face saving rate hike” and live to regret it when it has to reverse it. 

My view is that they should be patient (now that they’ve made all the previous bad decisions to steal from savers and reward companies for buying their own stock back with cheap money rather than innovate) and see what the next quarter brings and not ruin the Christmas buying season with another fit of market volatility.

Be sure to visit the website at: Sun and Storm Investing™

Standard Disclaimer: It’s your money and your decision as to how to invest it.

I thank Worden Brothers for the charting system I use to post these charts.  If you want to know more about the charting system I use every day, go to my “Other Resources” page here:  Other Resources   It makes it much easier to follow along with me if you can see the charts and manipulate them on your own computer.  It’s a great investment to have an excellent charting system.  Check it out with a free trial at the link above.

Note that the newsletter is now CLOSED to new subscriptions: Join the Wait List to Join the Newsletter as a Loyal Subscriber, Opening again for the January 3rd issue. If you join and don’t read the newsletter, you will be deleted. Why? I don’t publish to non-readers as other newsletters do. I surround myself with committed people who value what we are doing. Stay tuned here in the meantime and follow all the action via the Twitter® and StockTwits® links above.

Copyright © 2015 By Wall Street Sun and Storm Report, LLC All rights reserved.

Posted in Bonds, gold, investment, large cap stocks, S&P 500 Index, small cap stocks, Treasuries | Tagged , , , , , , , , , , , , , , , , | 1 Comment

Market Timing Brief for the 10-16-2015 Close (UPDATED 10-19-2015 “Volatility Healing of Market”): Stock Market Headed Higher. Gold Falls Under US Dollar Pressure. Rates Decline.

A Market Timing Report based on the 10-16-2015 Close, published Sunday Oct. 18th, 2015

UPDATE 10-19-2015: The Market Has Healed Substantially In Volatility Terms: Invest Accordingly

This was too important not to share quickly.  But first, here’s a very relevant secret that is likely worth billions of dollars: “No matter what the tricksters do, cannot hide three things – price, volume, and volatility.” 

For today, I’ll focus on volatility known as the VIX which is a measure of how frightened investors are to invest in the SP500 Index (you can search it and find the mathematical definition).  Here’s the gist of my insight today: After a volatility spike above 50, which was even higher than that seen in 2010 and 2011, this market has healed faster than after the Flash Crash of 2010, which was more or less a deep correction and far faster than following the 2011 pullback. 

In other words, healing of the market that normally takes months after a fear spike this huge, took far less time after the recent August 24th, 2015 Flash Crash than in 2010 or 2011.  We don’t even have to get into the 2008 comparisons they are so far off.  The VIX is not back below the 13.73 level it took off from, so it will be further confirmation should we drop back below that level and head to 12 and change.

My conclusion?  The fact that this market has healed so fast in face of a Fed rate hike is remarkable and you need to invest accordingly.  This is not 2008 until proven otherwise by a much more impressive volatility pattern.  Can I guarantee that won’t happen?  Of course not!  We are not babies around here who insist on things staying the same.  We shift our opinions when the market shows its colors. 

Meanwhile, my opinion that this was a 2011 redo has not changed since I hinted at that in early August.  In the meantime, the media has caught on to this idea and you’ve heard it elsewhere by now.

The August 2015 Flash Crash has turned out to be more benign thus far than either the deep 2011 correction or the 2010 Flash Crash correction. The first legs of those two corrections were of similar magnitude.  The 2nd leg of 2011 was a bit deeper at -21.6% (a “Bear market” which shows you the value of those ridiculous definitions – because the market rallied strongly from that low!) and -17.1% in the 2010 Flash Crash (from tops to bottoms).  The damage this time?  “Only” 12.5%, a healthy correction. 

This does not mean that the next market decline will be as benign as this one has been.  A VIX spike above 20 will be the first warning sign that we’re going to correct again at least as severely if not to the degree seen in 2011 (more than a 20% pullback).  What the “VIX healing” means is that to sit around worrying when the market has been behaving well is plain silly and is likely to cause an investor to sell when s/he should buy.  We remain ahead of the market with our recent buys.  Let’s be vigilant and “present” as we observe the markets.

How do you “stay present” as you invest?  Read this: A Primer On Fear and Greed

And now back to our regularly scheduled programming….. 😉

I deliver focused comments on the markets.  These are supplemented with “Tweets/StockTwits” (see links below).

1.  SP500 Index: I believe the market will continue higher to reach the 2044 level, where the market broke down in the first place.  That has been my target for some time.  Once a market has broken down and rebounds, it commonly bounces to the 50% retracement level of the prior fall, but it may also go to the 61.8% Fibonacci level. Of course, these levels are only approximate targets, and the market is more likely to pay attention to previous support and resistance levels, such as the 2044 level.  That is our next upside target.

The economic data including both retail sales and the producer price index (PPI) told investors that sales and pricing were both weak.  This hurts corporate profits on two fronts.  Deflation pushes pricing down, and consumers will commonly wait for even lower prices before they will buy if those forces are strong enough.

In the meantime, the large caps (SP500) went up while the small and midcaps lagged in the prior week as shown below the SP500 chart (the main index charted is biotech (IBB), but you can see how the SP500 has pulled above both the small cap (IWM) and midcap (IJH) lines.

SP500 Index (SPX SPY; click to enlarge):

sp500-market-timing-chart-2015-10-16-close

2044 is the next upside target.

ibb-vs-spy-ijh-iwm-market-timing-chart-2015-10-16

Biotech lags both the SP500 as well as the mid and small caps

The lack of recovery of biotech might be an ominous sign for the rest of the market as it was a market leader, but there is a catch.  A big part of the under-performance is drug pricing pressure, due in part to Secretary Clinton’s comments on outrageously high drug prices.  I saw this coming and reported on it earlier this past summer.  Investors did not like hearing it, but being aware of what is going on is preferable to playing dumb.

You can expect drug and biotech companies to suffer for much longer and perhaps the rest of the market can continue higher without them.  The gains in those two sectors have been phenomenal since the Affordable Care Act became a certainty.

One reason the market can go higher is that AAII.com investor sentiment showed slightly more Bearishness with Bulls dropping about 3.5% and Bears dropping only about 1% as the market ralliedInvestors typically get overly excited at tops and are not worried, so this market has the proverbial wall of worry to climb (meaning the worry is Bullish for the market).  Remember that sentiment is only one factor and major earnings successes or disappointments in the next batch to come this week may decide how high this rally takes us.  My sense is we’ll hit 2044 at least before the next downturn.   Earnings have not been bad enough so far to send the market back down.

Keep up to date at Twitter and StockTwits: See my messages on Twitter® Follow Me on Twitter®.   Follow Me on StockTwits®).

2. Small caps are now lagging the SP500 Index.  This is called bad breadth and indicates a weak overall market.  The small caps are still below the Sept. high.  Part of this may be investors wanting to play a rally back up, but without holding the higher beta small cap stocks in case of a pullback.  Particularly when volatility skyrockets, as it did at the end of August, investors try to avoid high beta stocks.

Russell 2000 U.S. Small Cap Index (RUT, IWM; click to enlarge):

rut-small-cap-index-market-timing-chart-2015-10-16-close

Small caps lag large caps.

3. Gold: 

Gold ETF (GLD): Gold made it through the orange triangle shown, but was held up by the yellow down trend line, which is a longer term trend line.  The fall occurred when the US dollar turned back up from support as shown in the TOP CHART of: This Update (Click!).

gld-etf-market-timing-chart-2015-10-16-close

Gold hit a longer term down trend line and fell as dollar strengthens.

4. 10 Year Treasury Note Yield: Yields fell again due to very weak US retail sales, and the perceived lower likelihood of a near term Fed rate hike.

U.S. 10 Year Treasury Note Yield (TNX,TYX,TLT,TBF):

tnx-10-year-treasury-note-market-timing-chart-2015-10-16-close

Rates continue down in range.

Be sure to visit the website at: Sun and Storm Investing™

Standard Disclaimer: It’s your money and your decision as to how to invest it.

I thank Worden Brothers for the charting system I use to post these charts.  If you want to know more about the charting system I use every day, go to my “Other Resources” page here:  Other Resources   It makes it much easier to follow along with me if you can see the charts and manipulate them on your own computer.  It’s a great investment to have an excellent charting system.  Check it out with a free trial at the link above.

Note that the newsletter is now CLOSED to new subscriptions: Join the Wait List to Join the Newsletter as a Loyal Subscriber, Opening again for the January 3rd issue. If you join and don’t read the newsletter, you will be deleted. Why? I don’t publish to non-readers as other newsletters do. I surround myself with committed people who value what we are doing. Stay tuned here in the meantime and follow all the action via the Twitter® and StockTwits® links above.

Copyright © 2015 By Wall Street Sun and Storm Report, LLC All rights reserved.

Posted in Bonds, gold, investment, large cap stocks, S&P 500 Index, small cap stocks, Treasuries | Tagged , , , , , , , , , , , , , , , , , , , , , , , | Leave a comment

Market Timing Brief for the 10-09-2015 Close: Stock Market Rally Still Strong. Will Earnings Ruin the Party? Gold Rallies On Weak U.S. Dollar as Rates Rise.

A Market Timing Report based on the 10-09-2015 Close, published Sunday Oct. 10th, 2015

I deliver focused comments on the markets.  These are supplemented with “Tweets/StockTwits” (see links below).

This week I’ll answer the question of “What would make this correction turn into a big bad Bear market?”

FIRST a GOLD UPDATE 10-12-2015: Gold is Really Following the US Dollar More Closely Than Interest Rates: This is why you must trade gold to make money in the near term in my opinion (IMO).

This chart is pretty revealing:

uup-us-dollar-vs-tnx-us-10-year-treasury-yield-vs-gld-gold-market-timing-chart-2015-10-12-1116am

Gold is following the US dollar more than US interest rates of late.

Do you see how gold is moving in synch with the US dollar (inversely; dollar up = gold down) and that the dollar has been in a tight range since about 4-23-2015?  I believe that the dollar will continue to determine gold’s next move and since the dollar is near the bottom of its range, gold could start to ease soon.  There seems to be an upspoken standoff between Dr. Draghi of the ECB and Dr. Yellen of our Fed. 

Both the US dollar and the Euro cannot win the race to the bottom.  The compromise is this unspoken range.  If Dr. Draghi strengthens Euro QE again, the dollar will strengthen.  If the Fed does not raise rates in December, the dollar will weaken.  I think gold is OK as a hold, but protect your trading gains within this range IMO.  Of course, if you disagree, do the opposite!  😉  We all think for ourselves around here.

What changes all that?  A violation of the range to the upside, so watch for it, because it will be a true game changer for gold Bulls.

And now, back to the critical question of “What Will Blow the Stock Market Up?”….

1.  SP500 Index: Our 2011 Scenario continues to unfold, now popular in the mainstream financial press, now that it’s clearly happening.  So far, this looks like 2011, not 2008 when the Great Recession began and stocks fell about 58% from top to bottom.

There is a big caveat that I’ll get to in a moment. First, have a look at the current chart.

SP500 Index (SPX SPY; click to enlarge):

sp500-market-timing-chart-2015-10-09-close

The rally continues…but will earnings stop it?

The Bulls made it through the 50 day moving average which is not exactly a secret check point, but some technical investors refer to it, and it can cause the market to pause, but not necessarily stop.  At times, the market will slightly exceed the more obvious checkpoints and then fail.  I was wrong to take off exposure early to the tune of about 12% (from 97% of maximum usual equity exposure worldwide to 85%), but still managed to capture 85% of the gains.  Capture at least so far.  The reason I took off some exposure early is that I expect earnings to disappoint the market to some extent and allow for a better buying opportunity.

By being exposed at the level of 85%, I’m still saying that I believe the market will muddle through a rough patch and move higher.  If you don’t believe that, you should be less invested than I am.  Decide for yourself and take responsibility for your decision.  Around here, we make our own individual investment decisions.  😉  If you or I end up being wrong, we need to recognize the error and make the necessary corrections in what we are doing.

The issue is whether this earnings season, which starts in earnest on Tuesday, will bring the stock market rally to an end.  The first company that reported at the start of the traditional earnings season so to speak was Alcoa which is now down 6.81% after a dismal report and forecast.  Before that it was YUM down 15.78% and Adobe (ADBE), initially down 7.20%, is now only down 1.56%.   The entire market cannot keep rallying unless this initial weakness is reversed by rising expectations for other stocks in the index.  With  growth slowing worldwide, where increased expectations will come from is the unresolved question.

I now need to answer the question I posed on social media on Friday: “What would turn this “2011 market” into a “2008 market”?  A recession is the answer.  Recessions are Bear market creators.  When the economy slows dramatically, earnings fall, and the stock market tends to discount the weak economy and lower earnings that accompany it out about 6 months.   This means that when earnings fall, stocks must fall, and this occurs before the low in the earnings cycle.  What defines a recession?  Negative growth in GDP for 2 consecutive quarters.  This is why some of those who monitor the slowing of growth are starting to predict a recession.  It doesn’t happen all at once.

Keep up to date at Twitter and StockTwits: See my messages on Twitter® Follow Me on Twitter®.   Follow Me on StockTwits®).

2. Small caps continued their bounce as well.  The risk is higher for them, because when the market falls they usually fall up to twice as much or more.  That is why we are steering clear of them for now.  Their earnings multiples are much higher than the SP500 Index stocks, so they have much further to fall should earnings continue to weaken.

Russell 2000 U.S. Small Cap Index (RUT, IWM; click to enlarge):

rut-small-cap-index-market-timing-chart-2015-10-09-close

Small cap rally continues as well.

3. Gold: Gold is looking good as discussed in an update, when it broke up and out of a triangle shown below (orange lines).  More details: Here.  Continue buying on shallow pullbacks, but protect profits.  If the Fed tightens in December, gold will not shine.   The falling dollar turned out to be more important than the rise in rates this week (see update chart at top!).  Rates cannot continue higher if the economy is slowing.   Recognize that if the rate trend does not reverse here, which I bet it would by buying Treasuries on Friday [update: sold those shares on Monday – see Twitter/ StockTwits for more], gold will not maintain the current rally, because the dollar’s fall will eventually be reversed by higher interest rates.  Money flows to where it is treated best.

Gold ETF (GLD):

gld-etf-market-timing-chart-2015-10-09-close

Gold bounce continues since the Fed decision not to hike rates.

4. 10 Year Treasury Note Yield: As just mentioned, rates cannot continue rising if the economy is slowing.  The Federal Reserve will have no choice but to stand pat.  And if recession rears its head, they may even come back with QE4.  They are addicted to the Bernanke policy slights of hand that have blown up the Fed’s balance sheet to massive proportions.  It’s all theoretically OK if rates don’t rise, but if they do as China and the rest of the world grows tired of buying U.S. debt and perhaps starts buying Chinese yuan as a new reserve currency at some point, the U.S. government will be forced into a default with resulting skyrocketing rates.  Think it cannot happen?  Realize that what the Fed has done has also never been attempted before.

U.S. 10 Year Treasury Note Yield (TNX,TYX,TLT,TBF):

tnx-10-year-treasury-note-market-timing-chart-2015-10-09-close

Yields climbed a bit since the Fed decision.

Be sure to visit the website at: Sun and Storm Investing™

Standard Disclaimer: It’s your money and your decision as to how to invest it.

I thank Worden Brothers for the charting system I use to post these charts.  If you want to know more about the charting system I use every day, go to my “Other Resources” page here:  Other Resources   It makes it much easier to follow along with me if you can see the charts and manipulate them on your own computer.  It’s a great investment to have an excellent charting system.  Check it out with a free trial at the link above.

Note that the newsletter is now CLOSED to new subscriptions: Join the Wait List to Join the Newsletter as a Loyal Subscriber, Opening again for the January 3rd issue. If you join and don’t read the newsletter, you will be deleted. Why? I don’t publish to non-readers as other newsletters do. I surround myself with committed people who value what we are doing. Stay tuned here in the meantime and follow all the action via the Twitter® and StockTwits® links above.

Copyright © 2015 By Wall Street Sun and Storm Report, LLC All rights reserved.

Posted in Bonds, gold, investment, large cap stocks, S&P 500 Index, small cap stocks, Treasuries | Tagged , , , , , , , , , , , , , , , , , , , | Leave a comment