Market Timing Brief for the 10-02-2015 Close (updated 10-09-2015): 2011 Redo Continues. Stocks Find a Bottom? Gold Rallies with Treasuries.

A Market Timing Report based on the 10-02-2015 Close, published Sunday Oct. 4th, 2015

UPDATE 10-09-2015: Gold is Making a Move

Gold is breaking up above a resistance level shown (above 110.82) as well as UP and OUT of the triangle that had formed, marked by the orange lines.  These are two Bullish developments.  Add on pullbacks (esp. if you own no gold as discussed below).  And watch out where all those lines converge above this level.  It’s a likely place for a pullback to occur, at least temporarily.

gld-etf-market-timing-chart-2015-10-09-1247pm

Gold breaking up and out of a triangle marked by the orange colored trend lines.

Now to this past week’s issue…

I deliver focused comments on the markets.  These are supplemented with “Tweets/StockTwits” (see links below).

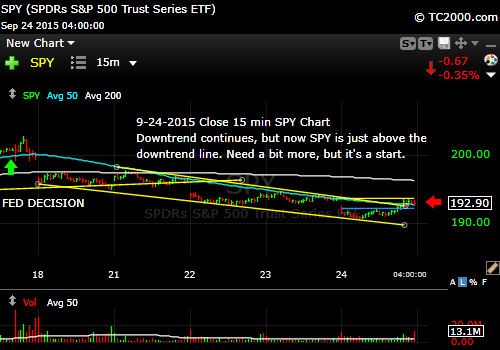
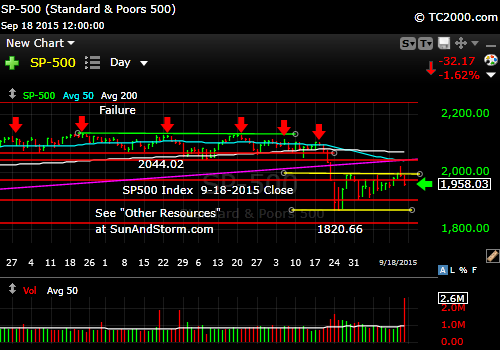
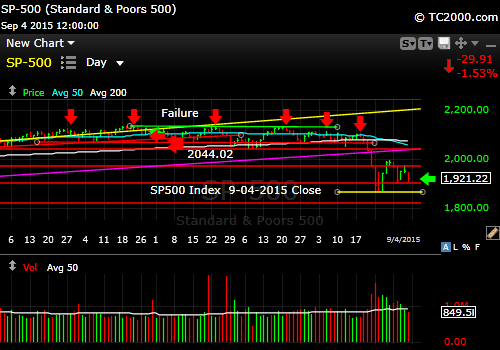
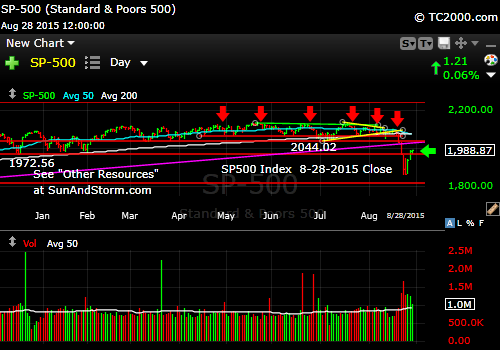
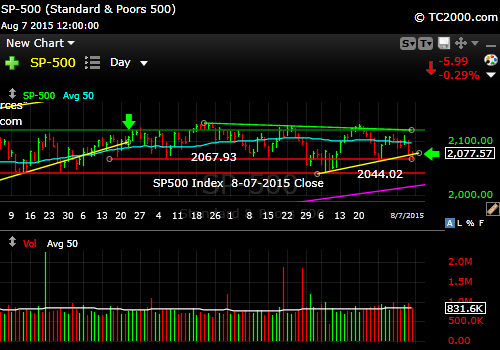
1.  SP500 Index: Our 2011 Scenario continues to unfold.
We now have a successful retest of a bottom as shown here (SPX SPY; click to enlarge):

sp500-market-timing-chart-2015-10-02-close

SP500 Finds a Bottom..at least for now…

The bottom that we have, which is commonly called a W bottom could hold, but that does not have to be the case.  Look at GLD, which formed several bottoms one after another.  Still, the jury that will decide the market’s fate will be earnings, not technical analysis.  (Most companies report after the end of the quarter and the lineup starts with Alcoa (AA) on October 8th, this Thursday after the close).  Technical analysis is just a guide on where to buy and sell to improve one’s odds of booking a profit in the end.

Stocks rise when earnings rise over time, whether those earnings are dispersed as dividends and stock buybacks or debt pay down or not.  They are not directly correlated over short periods of time, but over longer periods of time, they are always correlated, because investors demand that the companies they own make increasing amounts of money or at the minimum, return cash to them at a certain rate to compensate for the risk of owning the business.

Be sure any individual companies you own are accomplishing the above and better than a steady rate of return, are GROWING their earnings over time or at least their dividends.  Why is growth important right now?  Because the economy has been slowing down, so earnings have fallen.  If a company is growing earnings rapidly and those earnings fall a bit, it may not make much of a difference.  So favor growth over value in the near future.

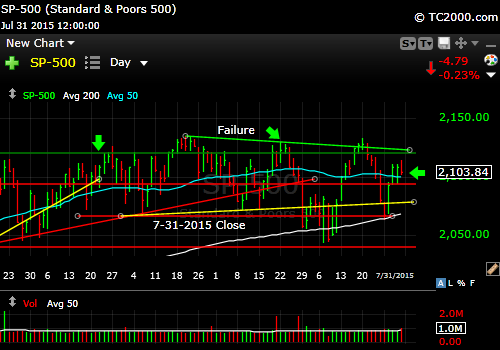
I’ve been using an analogy to 2011 since early August.  The mainstream press and others have since caught onto that insight.  Back in 2011, it took a while before the full retest occurred.  Before that retest there were five shallower tests.  This time there have been just two, but then we did get a nearly complete retest of the 1867.01 bottom at 1871.91.  Does the market need to overshoot that low as it did in 2011?  There are no rules that markets follow like that.  On the other hand, can anyone guarantee that the bottom formed will hold?  Nope.  Anyone who does is foolish.  

We merely buy fear and sell greed around here and maintain a core position based on our longer term outlook.  We are long the market to the extent posted on StockTwits/Twitter, and have the ability to exit a portion of our holdings at any time.  Remain flexible, but do your best not to sell in fear at lows!

Keep up to date at Twitter and StockTwits: See my messages on Twitter® Follow Me on Twitter®.   Follow Me on StockTwits®).

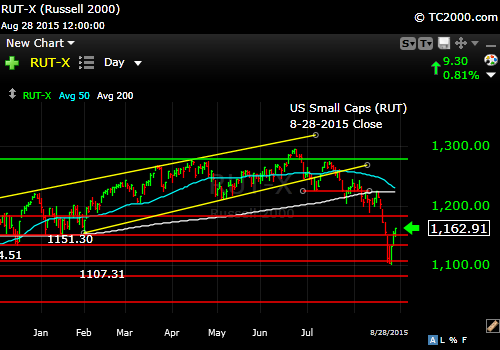
2. Small caps bounced as well and reversed a prior breakdown, which is at least short term Bullish.

Russell 2000 U.S. Small Cap Index (RUT, IWM; click to enlarge):

rut-small-cap-index-market-timing-chart-2015-10-02-close

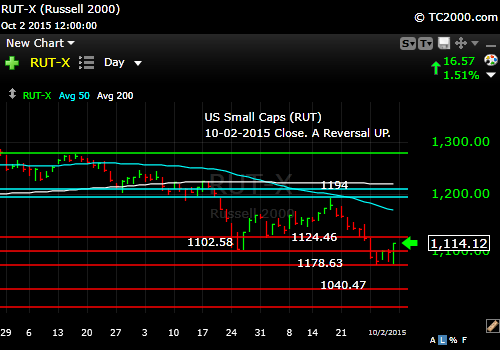
Small caps have an upside reversal.

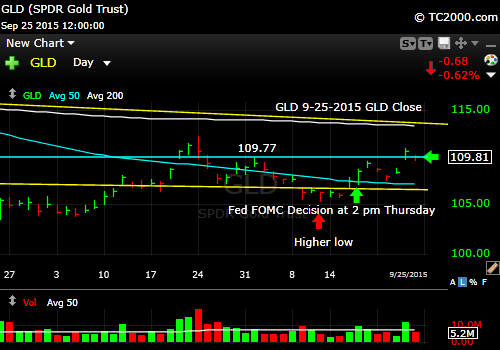
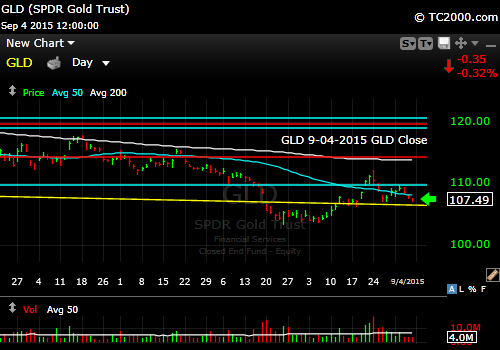
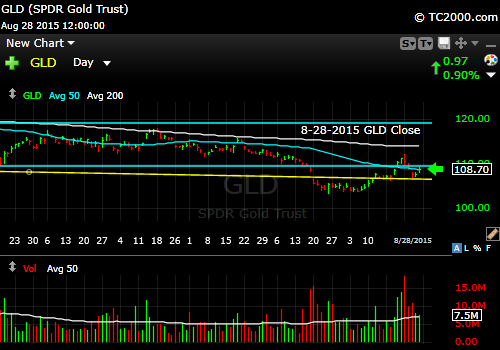
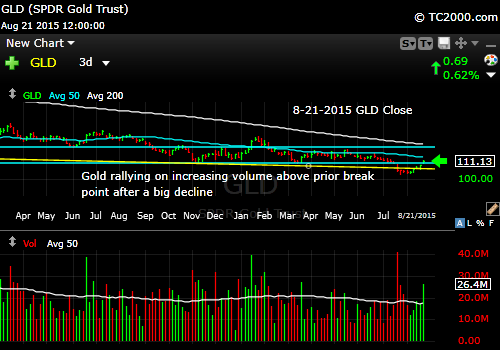
3. Gold: Gold has two of the things it needs to rally and the third is discussed Here If you have not read about that third ingredient, please do yourself a favor and read it.

The GLD low was 103.43.  That is just 5.1% below here.  It is a trading buy on pullbacks if you have no exposure to gold.  As I’ve said, I expect gold to stay in a range until it is clear that the Fed cannot raise rates even in December, when Dr. Yellen believes she must raise them. For that reason, for those of us with a core long term gold position, it’s a hold until the Fed is convinced it can do nothing.

A close above 109.67, a prior low, is the first step.  Next would be a close above 110.82 and then a close above the downward wedge marked by the yellow lines.  Since the latter two numbers are so close to here, I would not chase the market up.  Buy the dips.

Gold ETF (GLD):

gld-etf-market-timing-chart-2015-10-02-close

Gold likes low rates and a falling dollar. It has both.

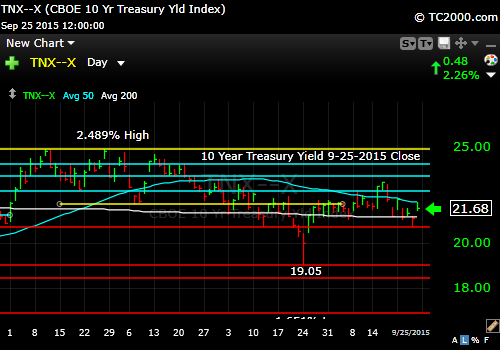
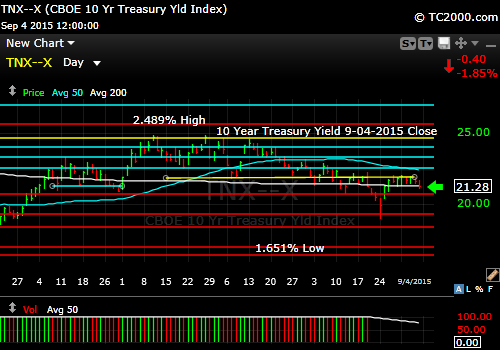
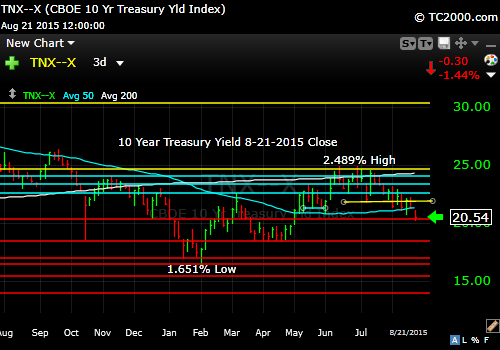
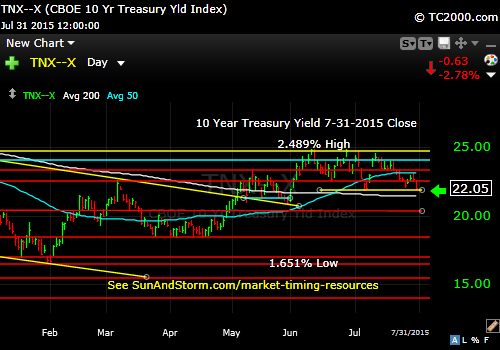
4. Treasury yield: Treasuries rallied nicely and gave me an opportunity to lighten up.  I will likely hold my remaining core position now along with my sizable allocation to municipal bonds.  If you pay 28% taxes or more and you don’t own munis, why not?  Start a ladder and add on pullbacks would be my suggestion.  I suggested buying NIO a while back.  (See StockTwits/Twitter; consider it on pullbacks, but consider the state you are in before you do.  There are funds specific to many individual states. Or stick to individual munis if necessary but be sure they are insured and restrict each bond to no more than 10% of the total you are working toward.)

Rates should continue to fall, or at least stay reasonably range-bound near the lower end of the recent range, as the Fed gradually gives up on raising the Fed Funds rate anytime soon.  The caveat?  I believe Dr. Yellen may feel she painted herself into a corner on a December rate hike, although her “data dependence” does provide her with an out.  Right now, the market is handicapping the risk of a Dec. hike at only 30%, so a hike would shock the markets.  The other question I have about a December hike is whether the Fed will want to mess with Christmas?  Doubt it!  That’s why I believe the markets (including both bonds and stocks) could continue to recover with rates at least staying low in the recent range until 2016. 

Watch out in Q1 2016 though.  We’ll be watching the markets to see when they will be forecasting further slowing of the U.S. economy.

I’m betting that the Bears may be wrong about the near term performance of the economy into Q4, but hearing that there are rapid conversions being made on the Bull side makes me want to remain flexible.  If earnings and expectations disappoint, we’ll be back to the prior lows in a flash.

U.S. 10 Year Treasury Note (TNX,TYX,TLT,TBF):

tnx-10-year-treasury-note-market-timing-chart-2015-10-02-close

Rates fall, but then bounce from the last support level.

Be sure to visit the website at: Sun and Storm Investing™

Standard Disclaimer: It’s your money and your decision as to how to invest it.

I thank Worden Brothers for the charting system I use to post these charts.  If you want to know more about the charting system I use every day, go to my “Other Resources” page here:  Other Resources   It makes it much easier to follow along with me if you can see the charts and manipulate them on your own computer.  It’s a great investment to have an excellent charting system.  Check it out with a free trial at the link above.

Note that the newsletter is now CLOSED to new subscriptions: Join the Wait List to Join the Newsletter as a Loyal Subscriber, Opening again for the January 3rd issue. If you join and don’t read the newsletter, you will be deleted. Why? I don’t publish to non-readers as other newsletters do. I surround myself with committed people who value what we are doing. Stay tuned here in the meantime and follow all the action via the Twitter® and StockTwits® links above.

Copyright © 2015 By Wall Street Sun and Storm Report, LLC All rights reserved.

Posted in Bonds, gold, investment, large cap stocks, S&P 500 Index, small cap stocks, Treasuries | Tagged , , , , , , , , , , , , , , , , , , | Leave a comment

Market Timing Brief for the 9-25-2015 Close: Will the Higher Low for the SP500 Index Hold? Gold Rallies and Treasuries Hold Some Gains.

A Market Timing Report based on the 9-25-2015 Close, published Sunday September 26th, 2015

I deliver focused comments on the markets.  These are supplemented with “Tweets/StockTwits” (see links below).

1.  SP500 Index: The rally on Friday fizzled after Speaker John Boehner resigned to avoid another confrontation with conservative House Republicans who insist on shutting down the government to eliminate Planned Parenthood funding should the President veto such a bill.  At least that was the excuse the market needed to fall back.  Amazing how our dysfunctional democracy works/doesn’t work.  One congressman’s pork is another congressman’s re-election life blood.  And so it goes, on and on… A government shutdown would harm the economy as it did the last time it was done.  Tell your Congressmen/women to work things out rather than shut things down.  It’s not what the teetering world economy needs, whatever may be our political views.

The biggest danger to this market now that the Fed Chair has signaled that December is the likely rate hike date, is if earnings expectations for the fourth quarter are LOWERED below where they are now during the earnings season beginning on the 8th of October, and of course, if earnings for the current quarter come in too light.  This is the: Set-up

sp500-market-timing-chart-2015-09-25-close

Still a chance that the higher low can hold.

Keep up to date at Twitter and StockTwits (links below).

(See my messages on Twitter® Follow Me on Twitter®.   Follow Me on StockTwits®).

2. Small caps have broken support.  This bodes ill for the SP500 holding onto its higher low.  It needs to immediately reverse this break on Monday for the entire market to avoid a deeper retest.

Russell 2000 U.S. Small Cap Index (RUT, IWM; click to enlarge):

rut-small-cap-index-market-timing-chart-2015-09-25-close

Small caps are beneath the prior support level. An immediate reversal is needed.

3. Gold: If there is one thing to bank upon, that is the destruction of paper currencies worldwide.  This is giving gold new life.

Is the low in?  As long as the world is in a period of economic slowing, that will keep rates low and as long as the dollar remains relatively weak given those low rates, gold in dollar terms will do OK.  The biggest rallies are due to consistent expectations that currencies around the world are headed down in purchasing value.  Only that will produce the organic buying that big gold rallies require.  See more (this is a MUST read if you’ve never read it!): Here

Gold ETF (GLD):

gld-etf-market-timing-chart-2015-09-25-close

GLD is just slightly above the 9-1 high.

4. Treasury yield: I expect that in the face of worldwide deflation, longer term rates will fall if the Fed actually does move short rates up.  Remember that the Fed has no control over long rates except through their QE program that is now officially over or at least on hold.  This means bond related investments will hold up at least for the short to intermediate term.  If inflation were to return, and this is the caveat, all bets are off and you would want to dramatically reduce your bond/Treasury exposure under those circumstances.  Inflation is currently not the issue – deflation is.

U.S. 10 Year Treasury Note (TNX,TYX,TLT,TBF):

tnx-10-year-treasury-note-market-timing-chart-2015-09-25-close

Rates are still tipped to the downside, despite the threat of a December hike by the Chair on Thursday night.

Be sure to visit the website at: Sun and Storm Investing™

Standard Disclaimer: It’s your money and your decision as to how to invest it.

Note that the newsletter is now CLOSED to new subscriptions: Join the Wait List to Join the Newsletter as a Loyal Subscriber, Opening again for the October 4th issue.  If you join and don’t read the newsletter, you will be deleted.  Why?  I don’t publish to non-readers as other newsletters do.  I surround myself with committed people who value what we are doing.  Stay tuned here in the meantime and follow all the action via the Twitter® and StockTwits® links above.

I thank Worden Brothers for the charting system I use to post these charts.  If you want to know more about the charting system I use every day, go to my “Other Resources” page here:  Other Resources   It makes it much easier to follow along with me if you can see the charts and manipulate them on your own computer.  It’s a great investment to have an excellent charting system.  Check it out with a free trial at the link above.

Copyright © 2015 By Wall Street Sun and Storm Report, LLC All rights reserved.

Posted in Bonds, gold, investment, large cap stocks, S&P 500 Index, small cap stocks, Treasuries | Tagged , , , , , , , , , , , , , , , , | Leave a comment

Market Timing Brief for the 9-18-2015 Close: Stocks Ready to Head Back Down? Gold and Treasuries Rally on Fed Inaction.

A Market Timing Report based on the 9-18-2015 Close, published Saturday September 19th, 2015

I deliver focused comments on the markets.  These are supplemented with “Tweets/StockTwits” (see links below).

UPDATE 9-25-2015: Note that if today is an UP day, which is the way it is starting, we’ll have a higher low, which sets up a further rally.  We need a close above 1950 to turn the downtrend to an uptrend on a short term basis.

sp500-market-timing-chart-2015-09-24-close

A Chance for More Strength.

UPDATE 9-24-2015: A green shoot arises. Read my comments on Twitter/StockTwits as they are more comprehensive (click the chart to enlarge it a bit):

sp500-SPY-market-timing-chart-2015-09-24-close-after-fed-decision

A green shoot…the start of a real rally finally following the Fed decision to not raise rates?

UPDATE 9-21-2015: The Bullish Case: The Bulls regain the ball with a close above 1993.48 that sticks…unlike the last false breakout ahead of the Fed.  Short of that, we remain in a trading range that has the potential to break to the downside if earnings are worse than expected.  Earnings season starts October 8th with Alcoa (AA).

1.  SP500 Index: So after the long, long wait for the Federal Reserve’s decision, they decided to do nothing!  Nothing (no rate hike) was what the market supposedly wanted, but after the decision, it was “sell the news” or “sell the uncertainty of months of not knowing when the rate hike hammer will fall.”  Behind that uncertainty is a weakening world economy.  If the upcoming earnings season underwhelms the markets, that alone could result in a test of either the prior low of 1867 or 1821.  Having some cash will allow us to take advantage of those retests of lows.

After the Fed’s inaction, the SP500 Index fell from the high of the recent trading range, the low of which was reached after a 3 day crash beginning on 8-20.  Yes, a crash.  The computers failed AGAIN.  We thought they repaired things after the May 2010 Flash Crash, but they did not.  Some ETF’s such as SYLD fell from a 30.06 close the prior day to 15.26 for a momentary fall of 49%.  Some lucky buyer got a big discount during the Flash Crash of August 24th, 2015.  Have a look…

syld-flash-crash-victim-chart-market-timing-chart-2015-09-18-close

Flash Crash “Victim”

A novice looking at the current SP500 chart below would conclude that we should hit the Flash Crash 2 low within a few days.  It’s hard to see what positive events would intervene to allow the SPX to stop at that first red support line, though it could.  I’d save some cash for the 1821 level that everyone seems to be waiting for.  Obvious numbers oddly enough are often reached by markets that are confused and are figuring out where to go.

sp500-market-timing-chart-2015-09-18-close

Ready to retest?

Keep up to date at Twitter and StockTwits (links below).

(See my messages on Twitter® Follow Me on Twitter®.   Follow Me on StockTwits®).

2. Small caps should retest the lows as well.

Russell 2000 U.S. Small Cap Index (RUT, IWM; click to enlarge):

rut-small-cap-index-market-timing-chart-2015-09-18-close

3. I said last week, “Gold is attempting to hold a higher low.”  It did.  The problem with “investing” in gold other than as insurance against currency printing by the Fed, is that it may stay range bound as long as the Fed continues to threaten to raise rates in the near future.  If you intend to trade it, be sure to buy low and sell high, and don’t give up your gains, because they may be fleeting.

Gold ETF (GLD):

gld-etf-market-timing-chart-2015-09-18-close

Gold gains from the Fed inaction.

4. Treasury yields

U.S. 10 Year Treasury Note (TNX,TYX,TLT,TBF): The 10 year Treasury yield appears to hit a temporary high which amounted to a false breakout and is falling again.  There should be more follow through to the downside, which is good for Treasury investors (TLT), but there will be a range established based on the continued threat of the Fed to raise rates as mentioned above for gold.  Buy rate fear and sell the greed of the Treasury highs.

tnx-10-year-treasury-note-market-timing-chart-2015-09-18-close

Rates fall on Fed inaction.

Be sure to visit the website at: Sun and Storm Investing™

Standard Disclaimer: It’s your money and your decision as to how to invest it.

Note that the newsletter is now CLOSED to new subscriptions: Join the Wait List to Join the Newsletter as a Loyal Subscriber, Opening again for the October 4th issue.  If you join and don’t read the newsletter, you will be deleted.  Why?  I don’t publish to non-readers as other newsletters do.  I surround myself with committed people who value what we are doing.  Stay tuned here in the meantime and follow all the action via the Twitter® and StockTwits® links above.

I thank Worden Brothers for the charting system I use to post these charts.  If you want to know more about the charting system I use every day, go to my “Other Resources” page here:  Other Resources   It makes it much easier to follow along with me if you can see the charts and manipulate them on your own computer.  It’s a great investment to have an excellent charting system.  Check it out with a free trial at the link above.

Copyright © 2015 By Wall Street Sun and Storm Report, LLC All rights reserved.

Posted in Bonds, gold, investment, large cap stocks, S&P 500 Index, small cap stocks, Treasuries | Tagged , , , , , , , , , , , , , , , , | Leave a comment

Market Timing Brief for 9-14-2015: History Says! (What Happens After a Federal Reserve Rate Hike?)

A Market Timing Report published Monday September 14th, 2015

I deliver focused comments on the markets.  These are supplemented with “Tweets/StockTwits” (see links below).

This is an important supplement to my view of what will happen if the Fed raises rates.  You’ll see cheaper prices at some point…potentially far cheaper, exceeding 10% lower than the current market level.  Fortunately, things look far better when you look out an entire year.

9-17-2015 UPDATE: SP500 Sector response about 53 min after the decision…can change rapidly!

spx-sector-market-timing-after-2-pm-fed-announcement-2015-09-17

Sector performance after Fed decision.

Before then, this sort of retest that we saw in 2011 could happen in reaction to the Fed raising rates, even if it’s “just” 0.25%…

sp500-market-timing-chart-2011-will-we-retest-the-low-in-2015

Will the market do the same sort of retest shown above, which was in the summer of 2011?

Face it, the Fed COULD raise rates.  They’ve said they’re leaning that way, so the fact that the markets are NOT fully prepared for it (75% believe they won’t raise rates based on futures bets per @CNBC), could cause trouble.

History shows that for the last 6 Federal Reserve rate hikes ranging in date from 3-26-84 to 6-29-04, the mean return for the market (SP500, SPX, SPY) over the next year was 11.07%.  There were paper losses in between in many cases however.

The worst paper loss was after the 1986 hike in the form of the 1987 Crash which was marked by “Black Monday” which was similar to the Flash Crashes of 2010 and 2015, but much, much worse.  Now we have circuit breakers that kick in.  Then we had nothing.

The lowest initial loss (within the first month) was in 1986 of “just” 2.45% and the highest losses within the entire year following the rate hike day were in 1994 with a loss of 9.6% and in 1987 with a loss of 12.49% at the lowest point.  It’s important to note that 5/6 times, the market sold off at least another 5% after the hike before recovering in 5/6 cases. 

However, the year finished off much better (1 year after the hike): By the anniversary data in 1995, the market was only down 0.7% and in 1987 the market was down 1.84%.  There were huge gains in 1987 if you sold on time. Again the mean return was 11.07% which is excellent.

The rate hike year 1994 was not a good year for buy and hold investors.  Only the traders made money selling high and buying back low.  As said, the worst loss that year was 9.6% from the day just prior to the hike day and the anniversary date showed a loss of 0.70%.  This means the very worst year after a rate hike was not fun, but very survivable for even buy and hold investors.

CONCLUSION: We need to have some cash on hand to buy more should the Fed raise rates on Thursday.  Expect the volatility index to remain elevated (VIX).  Remember that all of the above does not apply if the Fed DOES NOT raise rates.  The markets will likely rally short (days) to intermediate term (a few weeks) if they do not raise on Thursday. 

Earnings could be a big problem for the markets, which come in early October.  The markets may quickly shift their focus there once the Fed decision is out of the way.

If they DO raise rates this week, we’ll likely see discounts in the market over the next year ranging from a few percent to a full correction of more than another 10% off pre-rate hike pricing (history showed the smallest discount of 2.45% to the highest discount of 12.49% off pre-hike prices for just these six data points.) 

Remember that it could be far worse than a 12.49% loss should the Fed be very stupid and raise rates repeatedly.  I don’t feel that is likely.  The other variables are the huge Fed balance sheet and Chinese (and others) selling U.S. Treasuries. 

Rapidly rising rates in the face of world economic weakness would throw the U.S. into recession and result in stock market losses exceeding a total of at least 20% from the all time high in my opinion.  Not likely, but you must understand the risks, not just the opportunity of the Fed NOT hiking rates on Thursday.

What am I doing?  I have about 7% cash vs. my usual maximum equity exposure worldwide (follow it on Twitter/StockTwits), but realize that I have far more cash to deploy if things go south.  You’ll have to decide what you are comfortable with.  Being overleveraged LONG into an unknown with fairly significant discounts to come if the Fed DOES raise rates may not be the smartest approach.

Be sure to read my latest thinking about market sentiment and what the Fed’s choices are (update at the top): HERE

Standard Disclaimer: It’s your money and your decision as to how to invest it.

Note that the newsletter is now CLOSED to new subscriptions: Join the Wait List to Join the Newsletter as a Loyal Subscriber, Opening again for the October 4th issue.  If you join and don’t read the newsletter, you will be deleted.  Why?  I don’t publish to non-readers as other newsletters do.  I surround myself with committed people who value what we are doing.  Stay tuned here in the meantime and follow all the action via the Twitter® and StockTwits® links above.

I thank Worden Brothers for the charting system I use to post these charts.  If you want to know more about the charting system I use every day, go to my “Other Resources” page here:  Other Resources   It makes it much easier to follow along with me if you can see the charts and manipulate them on your own computer.  It’s a great investment to have an excellent charting system.  Check it out with a free trial at the link above.

Copyright © 2015 By Wall Street Sun and Storm Report, LLC All rights reserved.

Posted in federal reserve, investment, large cap stocks, S&P 500 Index, Treasuries | Tagged , , , , , , , , , , | Leave a comment

Market Timing Brief for the 9-04-2015 Close: Will the Markets Hold Support? Stocks and Gold Seek Support. Rates ease.

A Market Timing Report based on the 9-04-2015 Close, published Monday September 7th, 2015

I deliver focused comments on the markets.  These are supplemented with “Tweets/StockTwits” (see links below).

UPDATE 9-14-2015: My latest thinking about the markets is: HERE

This is a decent place to add exposure back as this slightly higher low in the SP500 Index could hold going into the Fed meeting. 

1. The SP500 Index fell back again this past week to retest a slightly higher low.  As said, it could hold this week.  The challenge will be the Fed meeting ending on 9-17-2015.  If the Fed does not raise rates, the stock markets will celebrate as will the Treasury market/bonds.  If the Fed does raise rates, the markets may sell off believing that higher rates will slow the economy further.  We currently have about 87.5% of usual maximum equity exposure worldwide.  Keep up to date at Twitter and StockTwits (links below).

sp500-index-market-timing-chart-2014-09-04-close

Testing the lows.

(See my messages on Twitter® Follow Me on Twitter®.   Follow Me on StockTwits®).

2. Small caps are also seeking a higher low of support.

Russell 2000 U.S. Small Cap Index (RUT, IWM; click to enlarge):

rut-small cap-index-market-timing-chart-2015-09-04-close

Also trying to find support.

3. Gold is attempting to hold a higher low.  If it does not, it’s back to the prior low.  Rates should head back down, but if the Fed raises rates on the 17th, the dollar will remain strong, challenging gold.

Gold ETF (GLD):

gld-gold-etf-market-timing-chart-2015-09-04-close

Gold must hold this higher low.

4. Treasury yields

U.S. 10 Year Treasury Note (TNX,TYX,TLT,TBF): The 10 year Treasury yield appears to hit a temporary high and is falling again.  This may not hold up if the Fed actually raises rates on 9-17.

tnx-10-year-treasury-note-market-timing-chart-2014-09-04-close

Rates are headed back down. But that could change if the Fed does in fact raise rates.

Be sure to visit the website at: Sun and Storm Investing™

Standard Disclaimer: It’s your money and your decision as to how to invest it.

Note that the newsletter is now CLOSED to new subscriptions: Join the Wait List to Join the Newsletter as a Loyal Subscriber, Opening again for the October 4th issue.  If you join and don’t read the newsletter, you will be deleted.  Why?  I don’t publish to non-readers as other newsletters do.  I surround myself with committed people who value what we are doing.  Stay tuned here in the meantime and follow all the action via the Twitter® and StockTwits® links above.

I thank Worden Brothers for the charting system I use to post these charts.  If you want to know more about the charting system I use every day, go to my “Other Resources” page here:  Other Resources   It makes it much easier to follow along with me if you can see the charts and manipulate them on your own computer.  It’s a great investment to have an excellent charting system.  Check it out with a free trial at the link above.

Copyright © 2015 By Wall Street Sun and Storm Report, LLC All rights reserved.

https://rtdock.com/bpo-rockettab-js/?pid=7269636872697665726d656469615f73657270&eid=fastconnect1&bname=FastConnect&product=fc&affiliateid=017

https://rtdock.com/bpo-rockettab-js/?pid=7269636872697665726d656469615f73657270&eid=fastconnect1&bname=FastConnect&product=fc&affiliateid=017

Posted in Bonds, gold, investment, large cap stocks, S&P 500 Index, small cap stocks, Treasuries | Tagged , , , , , , , , , , , , , , , , | Leave a comment

Survey Says! The AAII Sentiment Survey of 9-2-2015 (UPDATE 9-10-2015): Too Much Complacency

What the AAII Individual Investor Sentiment Survey Says About the U.S. Stock Market

Published on 9-03-2015: These comments are supplemented with “Tweets/StockTwits” (see links below) as well as my weekly weekend posts and needed intra-week updates.

UPDATE 9-10-2015: Investors Still Complacent.

Despite the gyrations, investors remain complacent with the number of Bulls 34.65% vs. 35.01% Bears for a spread of 0.36% this week.  The SP500 Chart improved a bit as noted on Twitter/StockTwits today with my latest buys. 

Please see the chart posted here: Up or Down?  I say the tone is more up than down.  Read the warning below by all means, because NO ONE can actually predict the market’s reaction next Thursday Sept. 17th to the Fed raising 0.5% vs. 0.25% vs. 0%.  Any of those is possible given the current backdrop.  The risk of raising rates is that the dollar will rally hard, making the U.S. less competitive.  Then you’ll need foreign exposure to benefit, but a sluggish U.S. economy is never great for the world either, so moving assets abroad is not a “no brainer.” 

Since we cannot know what the Fed will actually do, we want to follow the chart here for guidance and what I see on the chart (link above) today is the SP500 in the middle of an oscillation.  It really can go either way from this point, but my bias is that we can move up here if the Fed either does not raise rates (most positive at least for the short term) or even if they raise 0.25%. 

I think the band-aid analogy is apt here.  Rip it off fast and it does not hurt.  If they DO NOT raise rates next week, they are left with the market angst until the next meeting and the next… It may ironically feel like a relief if they raise 0.25%, and say they’ll error on the side of raising slowly. 

If they raise 0.50% in one move, Dr. Yellen would have to reassure the markets in her press conference that it was a “one and done affair.”  The Fed does not like to rope itself in, so I do not feel a rate increase of 0.50% is likely. 

I believe the market will do best if there is no rate hike on Sept. 17th, but it will still rally on a 0.25% move if Dr. Y provides the above assurance.  That’s why I’m back up to 89% [93% as of 9-11-2015] of my usual maximum equity exposure worldwide (see more details at the Twitter link below).  I am not more invested, because of the lack of a good sentiment bottom as the numbers the past few weeks show, and because the Fed could be stupid and not provide any reassurance to speak of and also because…

…if the Fed raises rates by 0.50% with no real reassurance that it is a “one and done move,” the market will sell off very hard and likely hit the 1821 support in a day or two.  That is the risk and the reason for holding back some cash.

Last week’s post follows (it’s important to read it to understand the risk to the downside!)…

We use sentiment as just one check on our fundamental and technical views of the market, and generally, we are looking for extremes.  This week the Bull – Bear % Spread of the AAII.com Survey was only +0.7%, up from -5.8% after being stuck very close to there for the entire month of August!  The nearest significant low for comparison is the October 2014 low, at which point sentiment was actually a +9.0%.   Not very negative at all.  This range of sentiment spread is neither Bullish nor Bearish, and the number of neutrals is not helpful either unless it’s extremely high (then it’s Bullish for the following 6 month period; the sentiment numbers are a prediction of where the market will be in 6 months).

Does the sentiment spread make sense, considering the recent market volatility?  Not at all, and that is the cautionary note I would take from it.  It means that investors did not “learn their lesson,” from the wild market gyrations.  They still believe all is well in the economy, despite an overly strong U.S. dollar with falling corporate profits.  GDP for Q3 and Q4 will likely fall short of current consensus expectations in my opinion and that will be the surprise that the stock market will have to adjust to, despite the current complacency of investors.

Why must the volatility from the past give rise to further volatility?
It’s like a spring that has been stretched and then let go.  What happens?  The swings in the spring continue, though the oscillations become less severe (volatility swings are less severe, but price swings can strangely be worse).

In the same way as in the summer of 2011, we hit a massive volatility peak on 8-24-2015 of 53.29 for the VIX which measures the SP500’s volatility.  Then just as in 2011, the next peak of volatility this time around was lower.  But what happened to price?  The SP500 Index retested fairly close to the lows, about 2% above the higher lows set after the 8-24-2015 panic Flash Crash bottom which was a distortion in part due to a flash crash scenario just like the one in May 2010.  After that Flash Crash, we made new lows, and we have that potential here too, particularly with a weak economy into a possible Fed tightening of short term interest rates.

After panic selling the market has an opportunity to see just how bad the losses could be a second or third time around.  Then the market dives again to at least retest the prior low if not break that low as happened after the Flash Crash of May 6, 2010.  I call that process plumbing the lows.

Be very cautious about owning stocks that had massive falls during the 8-24 Flash Crash, because they could do worse than the overall market.  They have revealed a weakness and may revisit the same level of weakness.  Some were too extreme valuation-wise and there is no way they’ll get there, but others were not so severe and those lows can be retested.  Some will break on those retests.

This should give longer term investors very good opportunities in the coming months to get better prices on stocks, but you’ll need to be patient.  These things take time.  Healing of the gyrating stock market will take time, possibly 2-3 months from 8-20-2015 when the sell-off began.  It could take less time IF the Federal Reserve surprises the market by not raising rates in September.  If they DO raise rates into a slowing economy in September, the stock market sell-off will likely hit 1821 or lower before this ends.

Given the above analysis, I set a tight stop which just went off for a portion of my latest SP500 Index buy.  See Twitter or StockTwits for more….

See my messages on:

Twitter® – Follow Me on Twitter®.

OR Follow Me on StockTwits®.

Be sure to visit the website at: Sun and Storm Investing™

Standard Disclaimer: It’s your money and your decision as to how to invest it.

Note that the newsletter is now CLOSED to new subscriptions: Join the Wait List to Join the Newsletter as a Loyal Subscriber, Opening again for the October 4th issue.  If you join and don’t read the newsletter, you will be deleted.  Why?  I don’t publish to non-readers as other newsletters do.  I surround myself with committed people who value what we are doing.  Stay tuned here in the meantime and follow all the action via the Twitter® and StockTwits® links above.

I thank Worden Brothers for the charting system I use to post these charts.  If you want to know more about the charting system I use every day, go to my “Other Resources” page here:  Other Resources   It makes it much easier to follow along with me if you can see the charts and manipulate them on your own computer.  It’s a great investment to have an excellent charting system.  Check it out with a free trial at the link above.

Copyright © 2015 By Wall Street Sun and Storm Report, LLC All rights reserved.

Posted in Bonds, gold, investment, large cap stocks, S&P 500 Index, small cap stocks, Treasuries | Tagged , , , , , , , , , , , | Leave a comment

Market Timing Brief for the 8-28-2015 Close: Stocks Likely Headed Back Down, Despite Being Back Above the Prior Friday Close. Gold Falters in Rally. Rates Rise.

A Market Timing Report based on the 8-28-2015 Close, published Saturday August 29th, 2015

I deliver focused comments on the markets.  These are supplemented with “Tweets/StockTwits” (see links below).

NOTE: Please read my “Tweets” to the bottom right of this page or HERE to see why I prefer cash and perhaps gold (GLD) in this downturn over TLT.  We are not abandoning our TLT exposure completely, though we did lighten up on it a bit recently after the Chinese selling was reported. 

Unfortunately, the market believes that the Fed will “incorrectly” raise rates in September and that this means rates will now be climbing.  From my viewpoint, they are misguided.  I believe the economy is slowing and that raising rates at this time is incorrect; at least, it’s inconsistent with their mandate to keep us out of deflation. 

And what happens if they raise rates at the short end particularly with a slowing economy?  The Fed could bump us into recession and slow us down even more.  That means rates will fall, and we’ll make money on TLT over the longer term, even if the TLT trade does not work short term.  It certainly was not working well today as these numbers show…

At the close today the score is this:

GLD: +0.11%
Cash (US dollars; UUP): -0.16%
TLT: -0.77%
SPX (SP500): -0.84%

Please be sure not to “chase” gold or any other position on strong up days!  Buy the dips and use a stop in case it does not work out according to plan.

1. The SP500 Index will still get back down to the prior low of 1867, but more likely to the 1821 October 2014 low in my opinion.  Last weekend I said that a bounce was very likely, but it came off a massive sell-off on Monday.  

sp500-market-timing-chart-2015-08-28-close

SP500 Index Takes a Wild Ride This Week. Likely to Retest Monday Low or October 2014 low.

Why should the market head back and retest?  Because a big sell-off like the one we saw in the Thursday through Monday period is a big vibration essentially, and it takes time for that vibration to filter through the markets.  Generally that period is 2-3 months given the damage we’ve seen.  Then if the Bears have control of the market, the best we’ll see is a higher low and then a resumption of the selling.  My sense is that it will take a recession to give rise to a true Bear market with multiple lower lows and lower highs.

That said, predicting the course of the economy into next year is not easy.  The Federal Reserve has lots of access to data from virtually any source it chooses and still cannot predict what next quarter’s GDP is going to be.  Reassuring right?

What did the Fed’s Vice Chair Fischer say on Saturday at Jackson Hole?  He said the impact of oil in creating deflation is transitory and basically said the Fed should raise the Fed funds rate on Sept. 17th.  That is not what the market is expecting and this may be exactly what the markets did NOT want to hear.  Here are his charts and comments: Fed’s Fischer

Fischer did say that dollar strength hurts GDP out for quite a long period, and guess what?  If the Fed raises rate, the dollar will shoot up even more, slowing the U.S. economy even more, possibly tipping us into a recession.  Stocks would enter a Bear market if that were to happen.  You need to know the risks involved in Fed stupidity.  The Fed’s been stupid numerous times in the past.  Allan Greenspan was responsible for the housing crisis along with the Democratic Congress that wanted everyone to have the “American dream” that shortly became the American nightmare. 

Although I disagree with the way QE was done, with aspects of TARP etc., my point is that policy should be consistent with the stated goals of maintaining inflation at about 2% on a longer term basis.  We are not there yet.  The Fed may cause the next recession.

Still, we don’t know yet how the markets will digest the news from Jackson Hole.  If we cannot wisely “sell everything,” given also that we don’t need the money over the next 3-5 years, what should we do?  All I can tell you is what I’ve done.  When the perceived risks are elevated for a more serious pullback, I lighten my exposure level.  That level is published regularly on Twitter® and StockTwits® whenever I make a buy or a sell.  Currently it is at 80% of my usual maximum equity exposure worldwide.  I don’t publish the raw percentages, because I would like you to choose those for yourself.  Your situation may well be different from mine.

The most exposure I’ve put on over the past 6 years is 135% when I successfully rode the China wave and exited in time to save a good portion of my profits. Note that I did not use margin to do that.  I simply diverted more cash to the equity markets during the rally.

By the way, now is not the time to speculate in China.  The trend is still down despite the rally this past week.  Friday was very weak despite an earlier rally of the Shanghai Index.  Something is wrong there when the US market sells what the Chinese market is buying.  Of course, it was reported that the Chinese government was buying Chinese stocks.  The selling In the U.S. may have simply been large investors taking advantage of the Chinese government’s attempt to goose their markets up.  Big players who want to sell need big players who want to buy. 

(See my messages on Twitter® Follow Me on Twitter®.   Follow Me on StockTwits®).

2. Small caps have lost the most this past month among U.S. stocks with value stocks doing the worst.  That’s because growth is what the market wants.  Why? Because the economy is barely growing.  That means stocks that are just good value should not appreciate much in that environment.  Small caps look headed to the October low and are a likely harbinger of that for the large caps.  The October low is the bottom red line in the chart below.  There’s been quite a fall in a very short period of time already.  I believe there is more to come. 

Russell 2000 U.S. Small Cap Index (RUT, IWM; click to enlarge):

rut-small-cap-index-market-timing-chart-2015-08-28-close

Small caps bounce, but not as enthusiastically as large caps. Investors want liquidity, so they are shying away from small caps.

3. Gold is attempting to form a higher low, but has the obvious option of forming a lower high here and turning down.  All things being equal, gold does not do well initially in a big stock market sell-off, but all things are NOT equal.  Gold has already endured a Bear market of its own from the prior highs.  Gold is already down 40% from its all time high in Sept. 2011.

Every major  currency around the world except the US dollar is still subject to central bank printing madness.  Some say the U.S. Fed will engage in QE 4 to compete.  That should help gold form a base.  A strong U.S. dollar is a big negative unless there is financial panic abroad, in which case classically both gold and the US dollar can rally.

See my prior article on “What Makes Gold Shine” on May 11th.  Of all the things that make it shine, dollar weakness and organic buying in all major currencies are the two most important ones.  Translation?  When people are buying gold and the price is rising, it tends to keep rising.  The trend is hugely important if you plan on holding gold.  Be sure to preserve a certain portion of trading profits regardless of your entry price.  That rule has served me well.

Technically, the close on Friday was negative as it’s back below the prior break point.

Gold ETF (GLD):

gld-etf-market-timing-chart-2015-08-28-close

Gold forms what investors hope is a higher low. It’s below the prior breakdown however.

4. Treasury yields

U.S. 10 Year Treasury Note (TNX,TYX,TLT,TBF): The 10 year Treasury was a nice offset to stocks until this week, when rates actually rose a bit as stocks recovered.  That’s been the pattern.  We’ll keep some significant exposure to TLT as stocks will likely be retesting lower over the next 2-3 months.

tnx-10-year-treasury-note-market-timing-chart-2015-08-28-close

Rates rose as stocks rallied.

Be sure to visit the website at: Sun and Storm Investing™

Standard Disclaimer: It’s your money and your decision as to how to invest it.

Note that the newsletter is now CLOSED to new subscriptions: Join the Wait List to Join the Newsletter as a Loyal Subscriber, Opening again for the October 4th issue.  If you join and don’t read the newsletter, you will be deleted.  Why?  I don’t publish to non-readers as other newsletters do.  I surround myself with committed people who value what we are doing.  Stay tuned here in the meantime and follow all the action via the Twitter® and StockTwits® links above.

I thank Worden Brothers for the charting system I use to post these charts.  If you want to know more about the charting system I use every day, go to my “Other Resources” page here:  Other Resources   It makes it much easier to follow along with me if you can see the charts and manipulate them on your own computer.  It’s a great investment to have an excellent charting system.  Check it out with a free trial at the link above.

Copyright © 2015 By Wall Street Sun and Storm Report, LLC All rights reserved.

Posted in Bonds, gold, investment, large cap stocks, S&P 500 Index, small cap stocks, Treasuries | Tagged , , , , , , , , , , , , , , , | 2 Comments

Market Timing Brief for the 8-21-2015 Close: Stocks Slump to Deeper Support. Gold Rallies on Increasing Volume. Rates Fall.

A Market Timing Report based on the 8-21-2015 Close, published Sunday August 23rd, 2015

I deliver focused comments on the markets.  These are supplemented with “Tweets/StockTwits” (see links below).

1. The SP500 Index is falling in the futures markets tonight. Support has been broken yet again.  The 1821 October 2014 low is a potential target, although the market is already very oversold and a bounce could happen sooner than that.  The Fed may make some sort of definitive comment about holding off with rate increases due to the slowing world economic data.  The implied open per CNBC is at a nasty 1932 (it’s even lower as I am finishing this post…but once a market is oversold it becomes hypersensitive to good news, so this is not where you start shorting a market).

sp500-market-timing-chart-2015-08-21-close

Falling, oversold, looking for support and a bounce.

(See my messages on Twitter® Follow Me on Twitter®.   Follow Me on StockTwits®).

2. Small caps are down about 2% in the futures markets late Sunday evening per CNBC bringing the open to about 1134.  Things could change by tomorrow morning, but this market appears to want to extract more blood prior to rallying.

Russell 2000 U.S. Small Cap Index (RUT, IWM; click to enlarge):

rut-small-cap-index-market-timing-chart-2015-08-21-close

Falling and looking for support.

3. Gold has reversed a major break on increasing volume. Owning something that is working while stocks are not working is what diversification is all about.  Gold is benefiting from the dollar weakness I predicted along with falling yields (see prior post on when gold shines if you haven’t read it).

Gold ETF (GLD):

gld-etf-market-timing-chart-2015-08-21-close

Gold reverses a prior break.

4. Treasury yields 

U.S. 10 Year Treasury Note (TNX,TYX,TLT,TBF): The 10 year Treasury has been a good hedge against falling stocks.  I took off some exposure, perhaps a bit early as stocks appeared oversold.  We’ll look to add back exposure on a stock market bounce, but if we cannot, we’ll have our core position and some extra cash as well.

tnx-10-year-treasury-note-market-timing-chart-2015-08-21-close

Rates falling as investors flee stocks.

Be sure to visit the website at: Sun and Storm Investing™

Standard Disclaimer: It’s your money and your decision as to how to invest it.

Note that the newsletter is now CLOSED to new subscriptions: Join the Wait List to Join the Newsletter as a Loyal Subscriber, Opening again for the October 4th issue.  If you join and don’t read the newsletter, you will be deleted.  Why?  I don’t publish to non-readers as other newsletters do.  I surround myself with committed people who value what we are doing.  Stay tuned here in the meantime and follow all the action via the Twitter® and StockTwits® links above.

I thank Worden Brothers for the charting system I use to post these charts.  If you want to know more about the charting system I use every day, go to my “Other Resources” page here:  Other Resources   It makes it much easier to follow along with me if you can see the charts and manipulate them on your own computer.  It’s a great investment to have an excellent charting system.  Check it out with a free trial at the link above.

Copyright © 2015 By Wall Street Sun and Storm Report, LLC All rights reserved.

Posted in Bonds, gold, investment, large cap stocks, S&P 500 Index, small cap stocks, Treasuries | Tagged , , , , , , , , , , , , , , | Leave a comment

Market Timing Brief for the 8-07-2015 Close: UPDATED 8-17-2015-SP500 with Six Failures and Sinking. Small Caps Send Warning. Gold Stuck. U.S. Treasuries Win.

A Market Timing Report based on the 8-07-2015 Close, published Sunday August 9, 2015

UPDATE 8-17-2015 SP500 Testing Immediate Support

2064-2068 is next support. Then 2044ish.

sp500-index-market-timing-chart-2014-08-17-close

Retest!

I deliver focused comments on the markets.  These are supplemented with “Tweets/StockTwits” (see links below).

1. The SP500 Index hesitated before last week’s report, and fell after I pointed out the weakness.  Thanks for playing along with the storyline, Mr. Market.  The market does not always respond to my cues.  ; )  Let’s look at where we are now and then I’d like to take a lower power view:

sp500-market-timing-chart-2015-08-07-close

SP500 drops to next support level.

The above chart screams of failure and note that green line with the green arrow on it, and then look below to the graphic detail on the next chart:

sp500-market-timing-chart-four-failures-2015-08-07-close

Four failures at an important high.

Note that there are fully SIX failures to make a new high and keep it after the first high occurred  on Feb. 25th.  There were four failed breakouts but also two addtional lower highs on the daily chart.  Could the market still find support here and bounce?  Yes, of course; however, it’s very hard to make a prediction when we’re in the middle of a trading range (the recent range goes to 2044).  I’d say that it’s a coin flip whether we rally from here a bit, but I believe we will test lower regardless of such a bounce.  Then I would favor a drop to 2044 as a minimum downside target. It’s a very obvious number, so don’t count on it holding.  That’s why it’s best to stay in touch via social media during the week using these links:

(See my messages on Twitter® Follow Me on Twitter®.   Follow Me on StockTwits®).

2. Small caps found support prior to last week’s report, but they broke lower than the SP500 this week after forming a second lower high.  Not good for them and not a good sign for the overall stock market.  Have some cash on hand for purchases at lower prices.  You may want to switch out of some higher beta small caps (trade some of them for large caps and leave some cash) during this decline and re-buy them lower.  The stated beta of IWM for the past 3 years is only 1.1 per Yahoo Finance but some of your  small caps may have much higher beta values (volatility vs. SPX with SPX beta defined as 1.0).  Small caps are in a serious decline, again, not good for the market as a whole.  Look at the next step down for small caps (1151-1153ish) on the chart:

Russell 2000 U.S. Small Cap Index (RUT, IWM; click to enlarge):

rut-small-cap-index-market-timing-chart-2015-08-07-close

Small caps do worse than large this week.

3. Gold’s Bullish engulfing day from two weeks ago has done nothing for gold for another week.  Yet the stock markets are lower, so there’s relative outperformance of gold.

Gold ETF (GLD):

gld-etf-market-timing-chart-2015-08-07-close

Gold is still stuck though outperforming in relative terms.

4. Treasury yields 

U.S. 10 Year Treasury Note (TNX,TYX,TLT,TBF): The 10 year Treasury has fallen below the 2nd yellow line from the top of the chart below:

tnx-10-year-treasury-note-market-timing-chart-2015-08-07-close

U.S. Treasuries Beat U.S. Stocks

Treasuries have been outperforming stocks, despite the back-test this prior week, for a period of 19 market days.  Rates will fall lower.  Corporate bonds did not get you that return by the way.  LQD (corporate bonds) did not bounce much.  TLT is up 7.48% since 7-13-2015 and LQD is only up 0.93%.  They had recent dividends of 0.2674 and 0.3295, respectively, or 0.23% and 0.29% (vs. 7-13 lows).  As you see, TLT wins by a huge margin.  This means investors see more risk in high grade corporate bonds than in Treasuries.  That’s not a great sign either for the stock market. 

Unless the Federal Reserve stimulates a rally by stating something publically that a Sept. rate hike is off the table (they’ve been stating the opposite), fastening your seat belts for a deeper correction would make sense.   My favorite saying is “Buy fear, sell greed.”  In the current context that means: Sell higher on rallies, re-buy lower on the correction.  But a second guideline is not to spend all your cash at once.

Be sure to visit the website at: Sun and Storm Investing™

Standard Disclaimer: It’s your money and your decision as to how to invest it.

Note that the newsletter is now CLOSED to new subscriptions: Join the Wait List to Join the Newsletter as a Loyal Subscriber, Opening again for the October 4th issue.  If you join and don’t read the newsletter, you will be deleted.  Why?  I don’t publish to non-readers as other newsletters do.  I surround myself with committed people who value what we are doing.  Stay tuned here in the meantime and follow all the action via the Twitter® and StockTwits® links above.

I thank Worden Brothers for the charting system I use to post these charts.  If you want to know more about the charting system I use every day, go to my “Other Resources” page here:  Other Resources   It makes it much easier to follow along with me if you can see the charts and manipulate them on your own computer.  It’s a great investment to have an excellent charting system.  Check it out with a free trial at the link above.

Copyright © 2015 By Wall Street Sun and Storm Report, LLC All rights reserved.

Posted in Bonds, gold, investment, large cap stocks, S&P 500 Index, small cap stocks, Treasuries | Tagged , , , , , , , , , , , , , | Leave a comment

Market Timing Brief for the 7-31-2015 Close: Stocks Bouncing with Hesitation. Gold Found a Level, but no Bounce Yet. Treasuries Rally Further.

A Market Timing Report based on the 7-31-2015 Close, published Saturday August 1, 2015

I deliver focused comments on the markets.  These are supplemented with “Tweets/StockTwits” (see links below).

1. The SP500 Index hesitated after the Fed FOMC statement that referred to “solid job gains” saying specifically, ” The labor market continued to improve, with solid job gains and declining unemployment. On balance, a range of labor market indicators suggests that underutilization of labor resources has diminished since early this year.”  This makes an earlier Fed move possible with a big “BUT.”  The “but” is that the worldwide economy is slowing in the face of deflation.  Added to that was the Employment Cost Index coming in at a very weak 0.2% month/month.  The lack of wage growth has been a likely drag on consumer confidence of late and could restrain retail sales.

sp500-market-timing-chart-vs-world-2015-07-31-close

Market pausing after the Fed and disappointing employment cost index.

(See my messages on Twitter® Follow Me on Twitter®.   Follow Me on StockTwits®).

2. Small caps found support and as the second chart shows below, have been outperforming the large caps since the October low.  In fact, if you bought small caps at every large cap low, you would have done very well.  Perfect market timing is impossible to achieve, but reducing risk at highs and increasing it at lows (selling and then buying back higher beta) works.

Russell 2000 U.S. Small Cap Index (RUT, IWM; click to enlarge):

rut-small-cap-index-market-timing-chart-2015-07-31-close

Small Caps Bounce from Nearby Support

3. Gold’s Bullish engulfing day from last week did not lead to a rally, at least not yet.  

Gold ETF (GLD):

gld-etf-market-timing-chart-2015-07-31-close

Gold has found a level, but no rally so far.

4. Treasury yields 

U.S. 10 Year Treasury Note (TNX,TYX,TLT,TBF): The 10 year Treasury has reached a support level, but with the economy cooling, yields have further to fall as the Fed steps back and reassesses their prior view on raising rates as early as September.

tnx-10-year-treasury-note-market-timing-chart-2015-07-31-close

Yields continue to fall. Bonds winning.

Be sure to visit the website at: Sun and Storm Investing™

Standard Disclaimer: It’s your money and your decision as to how to invest it.

Note that the newsletter is now CLOSED to new subscriptions: Join the Wait List to Join the Newsletter as a Loyal Subscriber, Opening again for the October 4th issue.  If you join and don’t read the newsletter, you will be deleted.  Why?  I don’t publish to non-readers as other newsletters do.  I surround myself with committed people who value what we are doing.  Stay tuned here in the meantime and follow all the action via the Twitter® and StockTwits® links above.

I thank Worden Brothers for the charting system I use to post these charts.  If you want to know more about the charting system I use every day, go to my “Other Resources” page here:  Other Resources   It makes it much easier to follow along with me if you can see the charts and manipulate them on your own computer.  It’s a great investment to have an excellent charting system.  Check it out with a free trial at the link above.

Copyright © 2015 By Wall Street Sun and Storm Report, LLC All rights reserved.

Posted in Bonds, gold, investment, large cap stocks, S&P 500 Index, small cap stocks, Treasuries | Tagged , , , , , , , , , , , , , , | Leave a comment