A Market Timing Report based on the 1-09-2015 Close, published Saturday January 10th, 2015
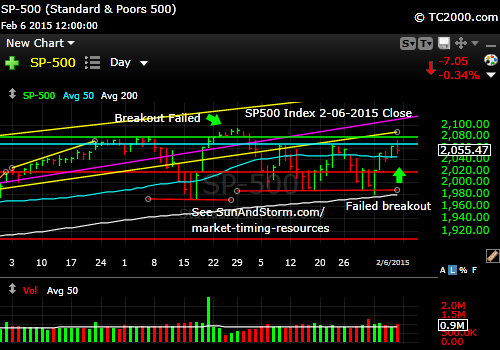
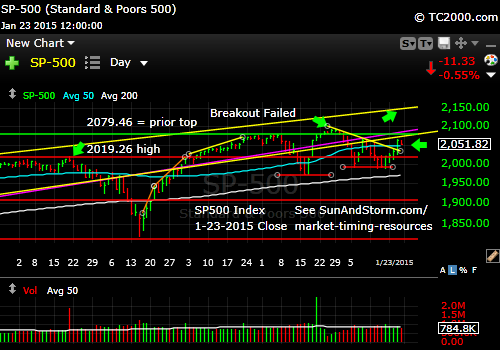
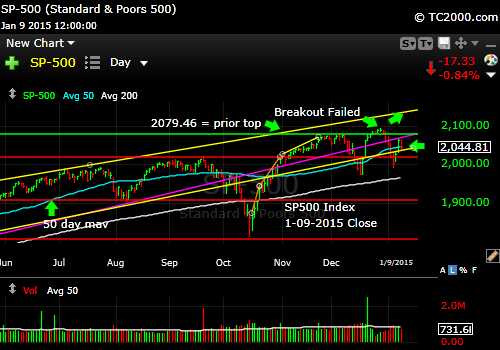
The S&P 500 Index (SPX, SPY) bounced from a higher low on the Fed Governor Evans’ comment that it would be a “catastrophe” to raise rates with the rest of the world stuck in either low growth, near recession, or recession. The pullback on Friday was within the bounds of the prior day, which was itself volatile to the upside. That is called an “inside day.” Interestingly, the SPY tested slightly below the range of the prior day, though it climbed back within the range by the close. So far, that counts as a consolidation, so there is both upside and downside risk at this point.
What does this mean on a practical level? It means that if you are Bullish, you can still buy, but if you are not sure that our economy won’t slow with the rest of the world, you would likely wait for lower prices to move more money into the market. A slower economy means lower earnings, which in the end WOULD drag the market down.
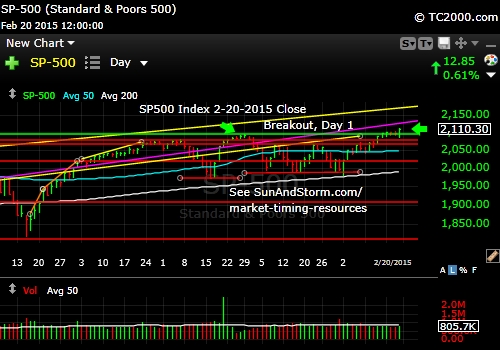
SP500 Index (SPX, SPY; click the chart to enlarge it):
SP500 bounces and consolidates. Not a great place to buy unless you are undoubtedly Bullish.
The economy produced 252,000 jobs last month, which is not bad at all, yet there are many who are predicting a slowing of U.S. GDP to perhaps 2% for the year, and that this job momentum is yesterday’s story unfolding. If so, this could put a damper on returns. The big wild card in the deflation scenario is that the fall of energy prices can spur economic growth, especially consumption. On that basis, the theory is that XLP, or the sector representing representing the consumer staples companies of the SP500, does well given the current scenario economic slowing with deflation.
So let’s see if that hypothesis is what the MARKET thinks: Yes, it is, as the chart shows. XLV and XLP are the winners this year. XLV (healthcare including drug companies) does well when the economy is slow and Obamacare ensures that even more drugs will be dispensed. XLU is behind them, but doing OK because low rates make utility yields look good:

XLV and XLP are the clear winners since 12-31-2014.
The worst performing sectors are XLF and XLE. Banks (XLF) do poorly with lower rates because the spreads they charge get smaller. We all know about the impact of lower energy prices on the companies producing energy, so down goes XLE. And that drop is not yet over, in case you get itchy fingers. Wait for a bottoming formation or at least a real rally in oil. I warned investors NOT to bite on XLE when oil was going up a bit, but still within a consolidation. And down it went, wiping out the early bird profits. The “too” early bird gets whacked in investing.
To find out what I’m doing, including buys and sells, please follow me here: Follow Me on Twitter®. Follow Me on StockTwits® You don’t have to make comments yourself to read my messages.
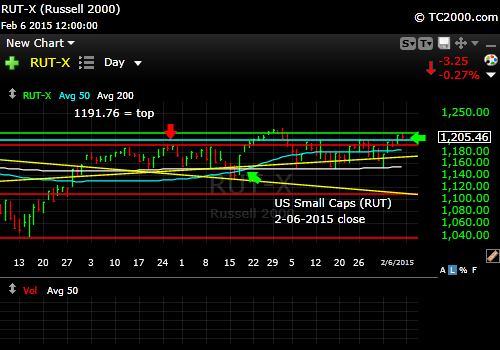
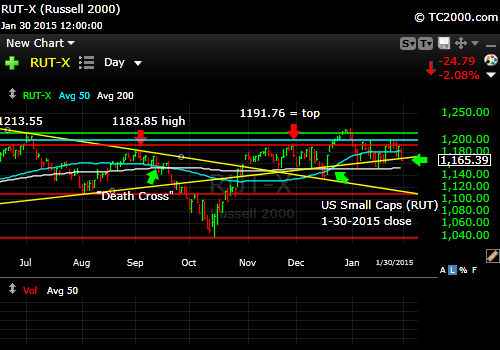
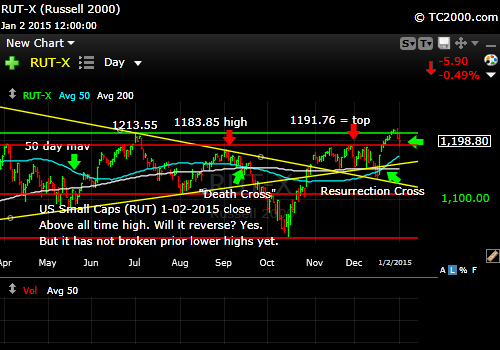
What about U.S. small caps? They have significantly faltered and present a greater risk (see the failure on the chart), but the pullback Friday could be a retest of the prior breakout. That means the trend could continue up on Monday, but it must do so promptly. I’d use a stop below that red line if I held small caps (not too close, because markets like to fool investors who set tight stops).
The U.S. Small Caps (RUT, IWM): Russell 2000 U.S. Small Cap Chart (click the chart to enlarge it):
Small cap rally halted at prior high. We are still above the lower highs which offers some support.
Gold did respond to the further fall in rates to some extent, but I believe that the worries about deflation over inflation will keep gold in a range at best. It could reach the upper yellow channel line in the chart and simply turn back down. Remember that I am talking in U.S. dollar terms here, not Euros or yen or other currencies that are going to Hades in a handbasket.
The Gold ETF Chart (GLD; click to enlarge the chart):

Gold is not falling apart but not rallying strongly either. Too much of a deflation threat for that in my opinion.
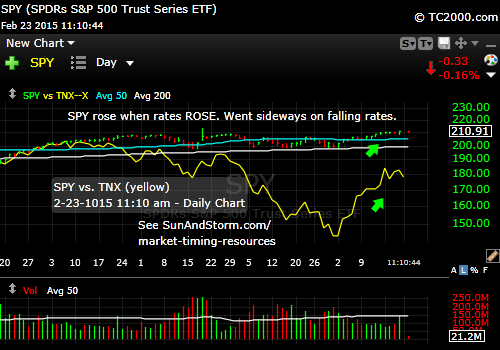
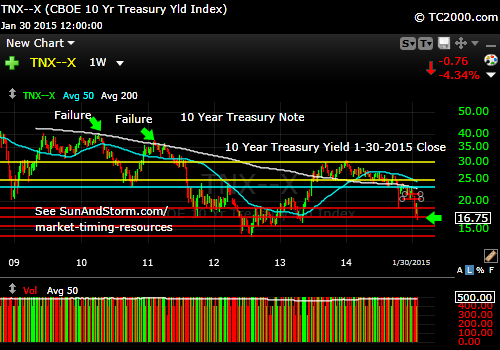
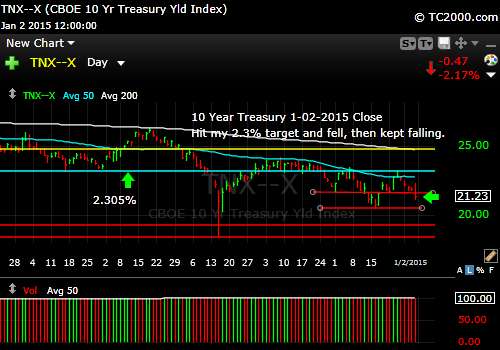
The 10 Year Treasury interest rate (TNX, tracked by TLT if Bullish; TBT if Bearish): The bond market is more clear than the stock market about what it expects. It absolutely expects deflationary pressure to continue. The 10 Year Treasury yield fell toward the prior low as the chart shows. This area could provide support IF signs emerge that the world economy is doing better. But maybe it won’t. If deflation is not interrupted, the 10 Year could reach the 2011 yield low again. That means more gains ahead for TLT investors. Munis should also do well, and I’ve increased my position. Taxes and low rates make munis attractive going into 2015.
Please Click the TNX Chart to enlarge it:

Rates plummet to prior low.
Summary: The U.S. stock markets are faltering, but this is neither a great place to buy or sell. Friday was a consolidation. Buying the highs in fear (lows in the markets) will be our strategy this year. Trimming a bit near the tops is not a bad idea, but timing is a tricky thing to do. Most of you will sell in the wrong place. Why do I know this? I’ve been there and done that too. It’s too easy to sell. It’s much harder to stay with a Bull market. I believe there is too much stimulus and too patient a U.S. Fed to warrant leaving the party yet.
Gold will likely hold its gains and as worldwide currency destruction continues will gain some strength. If the economy improves again worldwide, assets will seek a better return than gold, and it could fall significantly.
Rates are nearing the prior low, but if the world does not get its act together soon, deflation will rule and rates could reach the 2011 low that was retested in 2013.
In my counsel to those who receive my private newsletter (free, but you have to be a loyal reader to keep getting it as noted below), I am recommending just two markets, China and the U.S. for this year (check Twitter). I believe they both could continue to outperform the rest of the world that is looking for growth. Japan may have a shot with all their crazy direct market intervention (read that asset buying). Europe doesn’t seem to have the political will to do what Dr. Bernanke did for the U.S. due to the German influence on policy. The Germans don’t like to debase their currency. So Dr. Draghi of the ECB drags his feet while Rome burns (well, Italy is in recession!). Stick with the stock markets of the stronger economies for 2015!
I cover foreign markets on social media (see links above) and in my newsletter. Note that the newsletter is now closed again to new subscriptions: Join the Wait List to Join the Newsletter as a Loyal Subscriber, Opening again for the April. 4th issue. If you join and don’t read the newsletter, you will be deleted. I don’t publish to non-readers as other newsletters do. Stay tuned here in the meantime and follow all the action via the Twitter® and StockTwits® links above.
Be sure to visit the website at: Sun and Storm Investing™
Standard Disclaimer: It’s your money and your decision as to how to invest it.
I thank Worden Brothers for the charting system I use to post these charts. If you want to know more about the charting system I use every day, go to my “Other Resources” page here: Other Resources It makes it much easier to follow along with me if you can see the charts and manipulate them on your own computer. It’s a great investment to have an excellent charting system. Check it out with a free trial at the link above.
Copyright © 2015 By Wall Street Sun and Storm Report, LLC All rights reserved.
Share this with Facebook, Twitter or by Email: