A Market Timing Report based on the 6-17-2016 Close, published Sunday June 19th, 2016
I deliver focused comments on the markets. These are supplemented with “Tweets/StockTwits” (see links below).
1. SP500 Index: If you want to do market timing, the first thing you have to have a beat on is the Federal Reserve. The Fed FOMC statements resemble a word game in which some words are introduced and others are added each month to say something very similar from meeting to meeting or something completely different, the latter of which tends to shock the markets. My comments follow the changes below…
The summary statement is that the Fed has lost its power to influence the economy any further. Whatever they might do at this point to open the spigots further would be destructive.
Don’t worry. The Charts are just below the Fed comments. Be patient, as it is worth your time to understand what the market is reacting to in some detail.
Here are the changes in the Fed Statement that were made since the last meeting:
BOLD BLACK = NEW ADDED
RED = OLD REMOVED
Information received since the Federal Open Market Committee met in April indicates that the pace of improvement in the labor market [conditions have improved further even as] has slowed while growth in economic activity appears to have [slowed] picked up.
We have to do market timing around these paradoxes. This is remarkable! It’s the reverse of what we had last time. We are employing more people, while producing less. It’s no wonder productivity is on the decline, which in turn is a bad substrate for rising wages and consumption.
Although the unemployment rate has declined, job gains have diminished. Growth in household spending [moderated, although households’ real income has risen at a solid rate and consumer sentiment remains high] has strengthened.
Pluses: More are employed and spending is higher.
Since the beginning of the year, the housing sector has [improved further] continued to improve and the drag from net exports appears to have lessened,
Both pluses.
but business fixed investment [and net exports have] has been soft.
Minus. Businesses invest in themselves when there is growth in the economy.
[A range of recent indicators, including strong job gains, points to additional strengthening of the labor market.]
Minus. See below. The last line of my excerpt shows that the Fed believes the slowing in employment growth is transitory.
Inflation has continued to run below the Committee’s 2 percent longer-run objective, partly reflecting earlier declines in energy prices and [falling] in prices of non-energy imports.
Dollar strength does that as well as worldwide slowing resulting in deflation. There is too much production capacity across the world at the moment.
Market-based measures of inflation compensation [remain low] declined;
Not good as it indicates deflationary pressure.
most survey-based measures of longer-term inflation expectations are little changed, on balance, in recent months.
The Fed thinks the “market” is wrong and inflation expectations matter more than the bets being placed on Wall Street and in Chicago.
Consistent with its statutory mandate, the Committee seeks to foster maximum employment and price stability. The Committee currently expects that, with gradual adjustments in the stance of monetary policy, economic activity will expand at a moderate pace and labor market indicators will [continue to] strengthen.
Slowing employment gains = “It’s transitory.” That’s the Fed’s mantra for everything they don’t like.
Here is the tough medicine for all Fed heads (and the gridlocked Congress!): You are NOT supposed to be running the economy. The economy is supposed to run itself, and there is supposed to be some contribution from our gridlocked government in the form of conservative fiscal policies that aid in the formation of companies that will create completely new products. But because you have interfered at an unprecedented level and imagined yourselves as the all-powerful creators of the economy, the economy has now been overstimulated past the needs and desires of consumers for its goods on a worldwide basis.
For this reason, the economy is now slowing and the economic cycle is about to turn on you, the thoughtless interest thieves that you are. You have stolen from more conservative investors, the savers who generally have less, and have given the money to relative risk takers, who on average had more, but now the game is up as you are driving the entire banking and insurance industries into the dust beneath your egotistical feet. (This is not a vote against capitalism, but rather, for the belief that everyone should benefit from our economic success. My Dad who passed away in December ran a great small business in which he took care of his workers as well as his own family. We should follow that same model for the country.)
That concludes my message to the Fed. I know I should really state my opinion in a stronger way. 😉 They seriously need to have someone or something wake them up!
Now let me explain why very low rates are toxic over long periods of time. It’s because banks and insurance companies make money off the spread between the cost of borrowing money and the return on loaning out that money. Many have already made long term promises to investors to return 5% per year as is common in the insurance industry. How long can they keep that up with the yield on the 30 year US Treasury Bond at 2.432% this week? When do they simply go bust?
What’s the good news? Due to the exact same misguided policies of the Fed discussed above, we can expect that the markets will be LESS likely to sell off immediately, and I expect, or guesstimate that the market could still rally with the expected intermittent corrections to an even higher level than that already achieved. It could be that we only rise a few percent above the prior ALL TIME HIGH and then collapse into a true Bear market. In any case, we are staying long the U.S. for now.
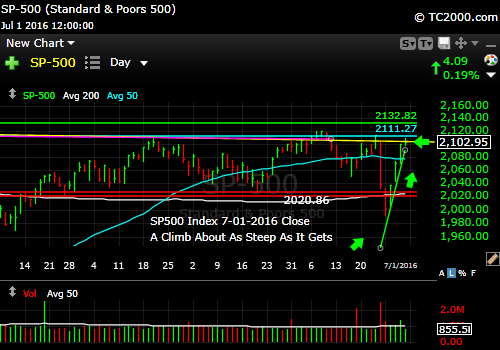
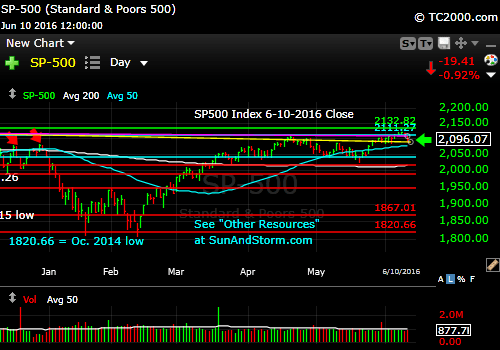
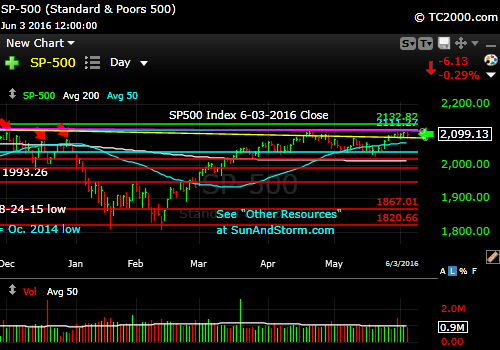
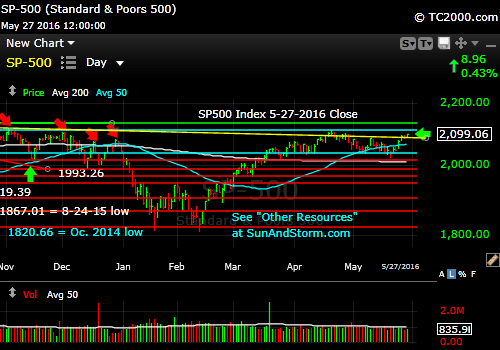
SP500 Large Cap Index (click chart to enlarge; SPX, SPY): read below the chart for next support…

Can the Bulls hold this level?
Survey Says! Sentiment still supports the Bulls. Sentiment this week among individual investors (AAII.com) showed a Bull minus Bear percentage spread at MINUS 12.15% this past Wednesday (Bulls 25.35%% and Bears 37.50% with Neutrals a Bullish 37.15%%). There is clearly room for this to expand, but as we saw very unenthusiastic interest in the market near the prior high, there is room for Bears and Neutrals to convert if given reasons to do so. Perhaps it will be the failure of Brexit to be passed in the UK that helps the Bulls grow their ranks.
Please keep up to date at Twitter and StockTwits: See my messages on Twitter® Follow Me on Twitter®. Follow Me on StockTwits®).
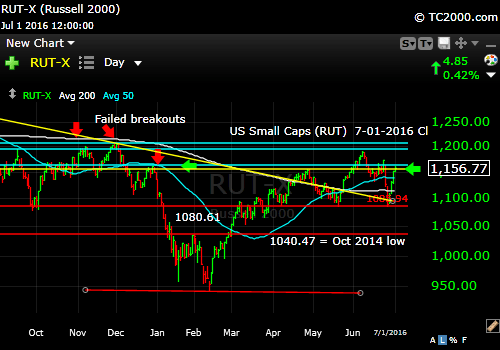
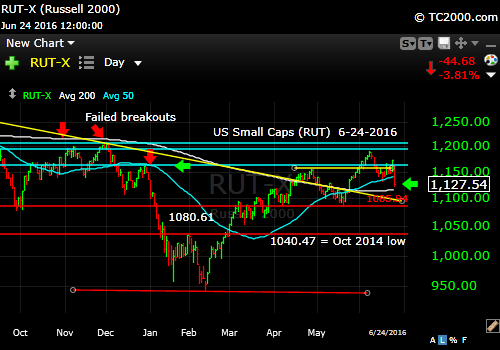
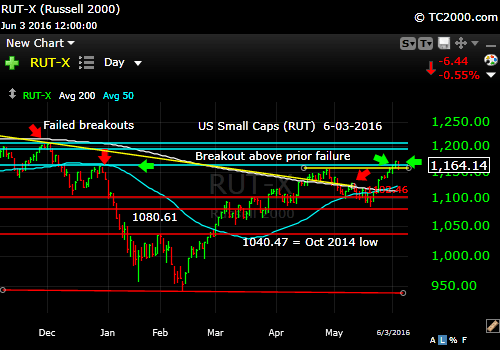
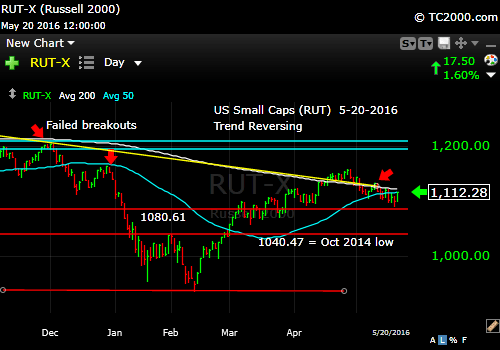
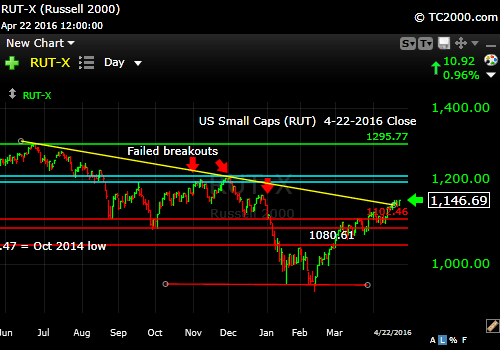
2. I repeat: U.S. Small caps are STILL above the 1040.47 level that for me defines a Bear market transition point. The trend is still up but another higher high is needed! Your risk will be higher here in small caps if the market decides to test lower instead of higher. That’s right, you are in the middle of a range now. It is difficult to market time the middle of a range. That is why we prefer to buy off the lows and let go of some exposure near highs. I see SP500 of 2020 as the nearby support. For RUT, support is around 1109. Earnings have been so poor over the past year for small caps in particular that they are likely range-bound at best. We’ll stick to mid caps and large caps.
Russell 2000 U.S. Small Cap Index (click chart to enlarge; RUT, IWM):

Small caps have made progress but unlikely to have earnings to support a big move.
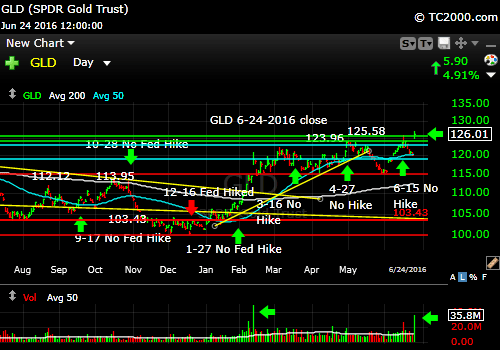
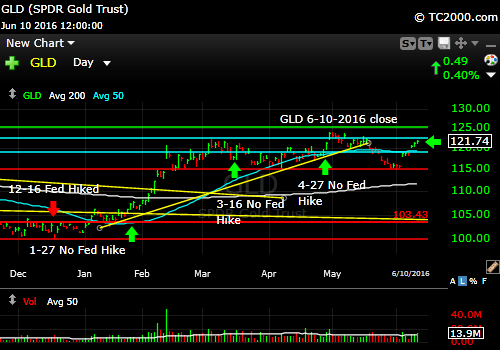
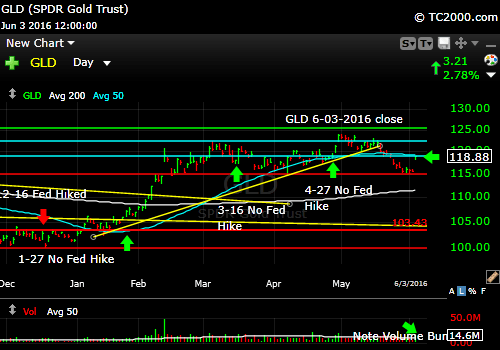
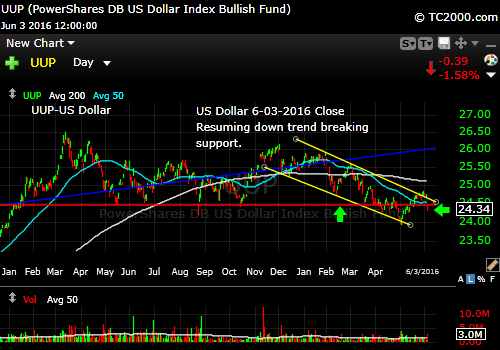
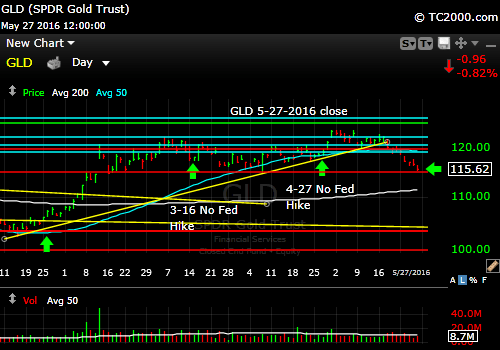
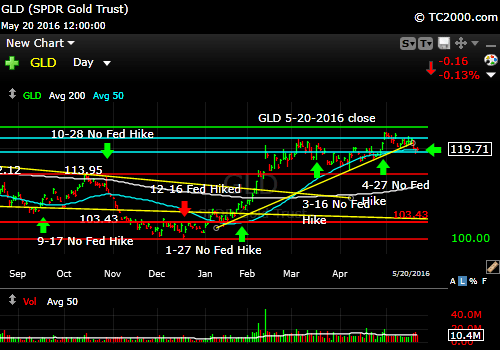
3. Gold: Gold initially swooned after the Fed as Treasury rates reversed from the prior low. I expect gold can continue its rally in the midst of negative interest rates abroad and exceedingly low rates in the U.S., but it must take out that 123.96 level and then 125.58.
UPDATE 6-20-16: The immediate challenge to gold is the dissipation of financial panic over Brexit this morning. The dollar and gold move up together in financial panic and down together when it lessens. The continuation of negative interest rates abroad and low rates in the U.S. will provide support for a further gold rally despite this “set back.” Note that any reversal of those policies will make thing tough on gold.
Gold ETF (click chart to enlarge the chart; GLD):

Testing 123.96 right now. Bounced back after initial swoon.
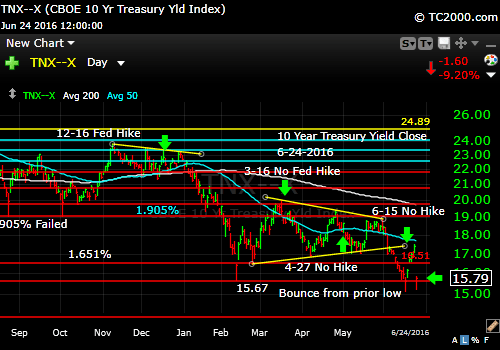
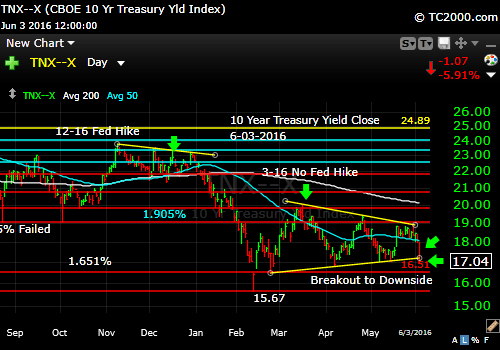
4. U.S. 10 Year Treasury Note Yield (TNX): No negative rates yet thank you, says the Treasury market. The Fed kept rates steady vs. negative rates abroad, which is why there was a retest of the prior major low.
U.S. 10 Year Treasury Note Yield (click chart to enlarge; TNX,TYX,TLT,TBF):
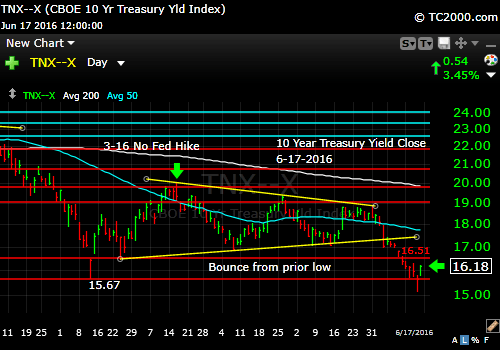
Rates bounce off the prior major low.
Stay with me throughout the week for the LATEST via the links to Twitter/StockTwits above. Feel free to comment, retweet etc. to spread the word.
Be sure to visit the website for more general investing knowledge at:
Sun and Storm Investing™
Standard Disclaimer: It’s your money and your decision as to how to invest it.
I thank Worden Brothers for the charting system I use to post these charts. If you want to know more about the charting system I use every day, go to my “Other Resources” page here: Other Resources It makes it much easier to follow along with me if you can see the charts and manipulate them on your own computer. It’s a great investment to have an excellent charting system. Check it out with a free trial at the link above.
Note that the newsletter is now CLOSED to new subscriptions: Join the Wait List to Join the Newsletter as a Loyal Subscriber, Opening again for the July 3rd issue. If you join and don’t read the newsletter, you will be deleted. Why? I don’t publish to non-readers as other newsletters do. I surround myself with committed people who value what we are doing. Stay tuned here in the meantime and follow all the action via the Twitter® and StockTwits® links above.
Copyright © 2016 By Wall Street Sun and Storm Report, LLC All rights reserved.
Share this with Facebook, Twitter or by Email: